BioMicroCenter:Caliper LabChip GX: Difference between revisions
Manlin Luo (talk | contribs) No edit summary |
Manlin Luo (talk | contribs) |
||
| Line 27: | Line 27: | ||
RNA metrics such as peak heights, peak areas, and concentration are used to determine an RQS (RNA Quality Score) number for each sample. The Caliper RQS is a calculated score that rates the quality of RNA samples. The RQS has been validated to correlate well with Agilent’s RIN (RNA Integrity Number) and follows the same 0-10 scale rating. Results comparing RIN to RQS for the same samples run on both LabChip GX and Agilent’s Bioanalyzer 2100 typically show <10% deviation. | RNA metrics such as peak heights, peak areas, and concentration are used to determine an RQS (RNA Quality Score) number for each sample. The Caliper RQS is a calculated score that rates the quality of RNA samples. The RQS has been validated to correlate well with Agilent’s RIN (RNA Integrity Number) and follows the same 0-10 scale rating. Results comparing RIN to RQS for the same samples run on both LabChip GX and Agilent’s Bioanalyzer 2100 typically show <10% deviation. | ||
=== [[BioMicroCenter:Caliper_INFO | RNA Analyses]] === | |||
'''How the Caliper Software Analyzes RNA Data ''' | |||
The LabChip GX RNA assay analysis determines the quality of the RNA sample by measuring the relative amounts of know RNA fragments relative to the total RNA present in the sample. Results for each well are calculated after all data for the well has been read. The data analysis process for RNA assays consists of the following steps: | |||
1. Raw data is read and stored by the system for each individual well. | |||
2. The data is filtered and the resulting electropherograms of all wells are plotted. A curve spline fit to the data is performed to generate a baseline above which RNA fragment peaks are detected. | |||
3. Peaks extending above the baseline are identified for all wells and are tabulated by migration time. | |||
4. A sizing ladder (see the figure below), which is a mixture of RNA fragments of different known sizes, is run first from the ladder vial. The concentrations and sizes of the individual nucleotides present in the ladder are predetermined by the assay. A dye matching the lowest peak in the ladder is run with each of the samples. This lower marker, labeled LM in the RNA sample (see figure below) is used to align the ladder data with data from the sample wells. | |||
[[Image:BioMicroCenter_caliper ladder.jpg|center|200px]] | |||
=== [[BioMicroCenter:Caliper_INFO | Software]] === | === [[BioMicroCenter:Caliper_INFO | Software]] === | ||
The LabChip GX software for data analysis allows users to visualize results via an electropherogram or virtual gel view and provides data in tabular form, which can then be analyzed or easily exported into a spreadsheet format. The soft ware is available for download from BioMicro at http://biomicro-bioanalyzer.mit.edu/ | The LabChip GX software for data analysis allows users to visualize results via an electropherogram or virtual gel view and provides data in tabular form, which can then be analyzed or easily exported into a spreadsheet format. The soft ware is available for download from BioMicro at http://biomicro-bioanalyzer.mit.edu/ | ||
Revision as of 19:09, 18 March 2011
| HOME -- | SEQUENCING -- | LIBRARY PREP -- | HIGH-THROUGHPUT -- | COMPUTING -- | DATA MANAGEMENT -- | OTHER TECHNOLOGY |

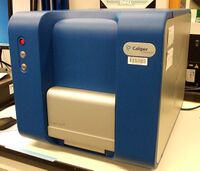
The Caliper LabChip GX is the most accurate and advanced nucleic acid separations system. The GX suite of instruments utilizes Caliper’s innovative microfluidics technology to perform reproducible, high-resolution, eletrophoretic separations.
- Complete assessment of RNA quality for better gene expression data
- Exact sizing and quantitation of DNA fragments
- Extreme accuracy with resolution down to 5 bp and sensitivity of 0.1ng/ul
- Flexible with 96 and 384 well compatibility
- Comprehensive and quantitative analysis with LabChip GX software
HiSens DNA
Sensitivity:
Standard Workflow
- 5 pg/μL per fragment
- 100 pg/μL for smears
Limited Sample Workflow
- 10 pg/μL per fragment
- 200 pg/μL for smears
Total RNA
RNA metrics such as peak heights, peak areas, and concentration are used to determine an RQS (RNA Quality Score) number for each sample. The Caliper RQS is a calculated score that rates the quality of RNA samples. The RQS has been validated to correlate well with Agilent’s RIN (RNA Integrity Number) and follows the same 0-10 scale rating. Results comparing RIN to RQS for the same samples run on both LabChip GX and Agilent’s Bioanalyzer 2100 typically show <10% deviation.
How the Caliper Software Analyzes RNA Data
The LabChip GX RNA assay analysis determines the quality of the RNA sample by measuring the relative amounts of know RNA fragments relative to the total RNA present in the sample. Results for each well are calculated after all data for the well has been read. The data analysis process for RNA assays consists of the following steps:
1. Raw data is read and stored by the system for each individual well.
2. The data is filtered and the resulting electropherograms of all wells are plotted. A curve spline fit to the data is performed to generate a baseline above which RNA fragment peaks are detected.
3. Peaks extending above the baseline are identified for all wells and are tabulated by migration time.
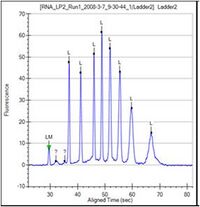
4. A sizing ladder (see the figure below), which is a mixture of RNA fragments of different known sizes, is run first from the ladder vial. The concentrations and sizes of the individual nucleotides present in the ladder are predetermined by the assay. A dye matching the lowest peak in the ladder is run with each of the samples. This lower marker, labeled LM in the RNA sample (see figure below) is used to align the ladder data with data from the sample wells.

The LabChip GX software for data analysis allows users to visualize results via an electropherogram or virtual gel view and provides data in tabular form, which can then be analyzed or easily exported into a spreadsheet format. The soft ware is available for download from BioMicro at http://biomicro-bioanalyzer.mit.edu/
