Pecreaux:Image Processing
 |
|
Research Interests in Image Processing
Strong quantification methods are required to model systems/networks in biology
A common need to modeling approaches of living is quantification. Because we aim to understand a complex network/system of components, our quantification approach must fulfill three requirements:
- perturb the system as little as possible since it is usually difficult to delineate a priori to which pathway/network the components belong, and their relation to the studied process: there is no “safe to disturb” pathways.
- measure should be done in vivo to preserve as much as possible the environment of the studied network / system.
- measure should be dynamic, to enable us to see the evolution of the systems in time.
Such a non-pertubative quantification is central to any modeling approach to validate the model by detailed and reliable challenging experiments. We thus devote a special effort in setting up suitable methods featuring customization of microscopy set-ups and application and development of image processing techniques.
Advantages of quantification based on images are fivefold:
- Imaging living samples limits interactions with the sample. It could however suffer a limitation: light can induce various chemical reactions leading to deleterious consequences; all these effects are named photo-damages. Recent technological breakthroughs (e.g. electron multiplied CCD cameras) allow now to reduce drastically illumination intensity and make optical imaging really minimally perturbative.
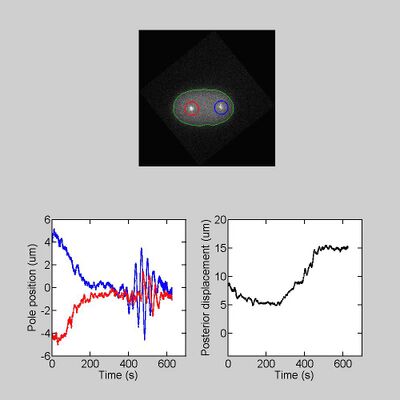
- Although perturbations are very reduced, quantification can be very precise as seen for example in the tracking of the centrosomes below (10 nm accuracy in space). However, to reach such performances, a special effort must be devoted in the development of the computer algorithms.
- Non-supervised aspect of these techniques (automatization) also enables high-throughput. This is a key advantage for two reasons: First, to acquire enough datasets to make statistical studies and characterize subtle though reproducible effects. Second, within each dataset, it enables acquiring a large number of time-points to get confidence on the result based on analyzing time dynamics.
- A non supervised analysis (the results are checked for relevance by an human afterward though) also avoids introducing the risk of bias compared to analysis by an human who know the expected result. It is also independent of the experimenter. This is an unbiased and reproducible measurement technique.
- Pushing this idea even further, because the measuring method can be modeled (as we did for trajectories analysis in the spindle positioning project or for the fluctuations of giant unilamellar vesicles below), the way the experimental errors impact the final result could be explicitly computed, and in consequence, one can assess how precise are the computed results.
Although image processing based methods are highly suitable to quantify networks / systems, a limitation must be mentioned: not all quantities can be measured through images either because of the lack of marker (to measure a concentration e.g.) or because the quantity can hardly be measured without assuming a biophysical model (force exerted on the spindle e.g.).
Past achievements
Towards measuring and characterizing membrane micro-undulations
detection
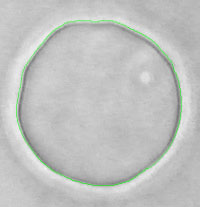
Based on phase contrast images of giant unilamellar vesicles (GUV) acquired at high speed imaging (30 frames per seconds) using non-standard camera, I took advantage of characteristic halo visible around objects in phase contrast microscopy (Inoué and Spring, 1997) to detect on the fly, with 80 nm accuracy, the contour of the vesicle, without any model assumption ( Pécréaux, 2004 ; Pécréaux et al., 2004). Indeed, at that time, it was not technically possible to store massive series of images and the image processing must be done in real time with the acquisition.
analysis
A suitable Fourier analysis and numerical fitting of the power spectral density enabled us to compare model and experimental results. In particular, finely taking into account the imaging process required some adaptation of the classic least-square fitting ( Pécréaux et al., 2004).
motivation: why measuring micro-undulations of a membrane ?
The micro-undulations of a lipid membrane are characteristic of its mechanical properties. The distribution of these undulations per size (the fluctuation spectrum) is very discriminant of the physics that dictates the mechanical behavior of the membrane. For this reason, the fluctuation spectrum could be seen as a specific signature of the mechanics of the membrane. The physics tool associated with a fluctuation spectrum analysis is Fourier analysis. In contrast with the previous work (Dobereiner et al., 1997; Faucon et al., 1989; Strey et al., 1995), I aimed to measure this fluctuation spectrum independently of any hypothesis of model.
Tracking
Why designing a specific tracking approach
To model and understand the mechanisms that control spindle positioning, we set to track the position of the microtubule organizing centers (centrosomes) along time. We aimed to characterize their motion to model it. This characterizing must be performed at high frame-rate to capture the dynamics. Furthermore, a large enough number of embryos must be considered to establish statistical significance of the characteristics difference between mutants and normal embryos; this comparison enables us to connect cell scale modeling to molecular details. Eventually, we aimed in a second version of the algorithm to use the micro-movements of the centrosomes to design a model of their centering. Altogether, these needs call for a customized, high accuracy, non-supervised tracking, which was non available in commercial or open-source products
Outlines of the tracking algorithm
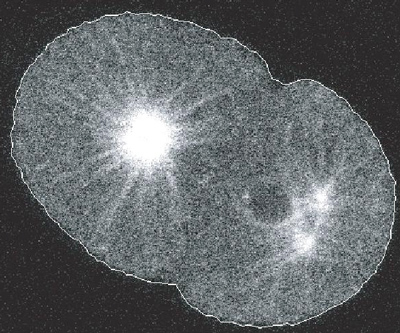
We classically broke our tracking algorithm into four steps: (1) preprocessing (prepare images for optimal analysis), (2) detecting candidates (find spots being potentially the images of centrosomes), (3) score them to select the most appropriate and (4) eventually link them to the centrosomes detected in the previous frames in time to create trajectories.
- Preprocessing. We filtered the noise at very short space scale because this noise comes rather from imaging artifacts than from the sample itself.
- Detection was based on cross-correlation with a pattern mimicking a centrosome and giving a penalty to structures too large.
- Select candidates. The spot offering the strongest correlation based on their shape mainly, disregarding their intensities, were selected and tested to be good enough candidates.
- Linking. Eventually, since the centrosomes are large structures, they cannot move fast, and then we linked the spot to the closest trajectory over the last second.
Fourier analysis of the trajectories provided two tests: first, the plateau at high frequency measured the (white) noise present in the detection (modeling tracking noise by an additive Gaussian white noise): from this measurement, we got typically a 10 nm accuracy. Such an accuracy was only possible because of the tracking of a large shape using correlation. Second, we fixed embryos, meaning that we cross-linked all the proteins, and we imaged and tracked them as usual. We saw a fluctuation spectra typically two orders of magnitude lower. This suggested that no spurious frequency was injected by the tracking (or by mechanical or detection devices).
Contour detection
At cell scale and in 2D
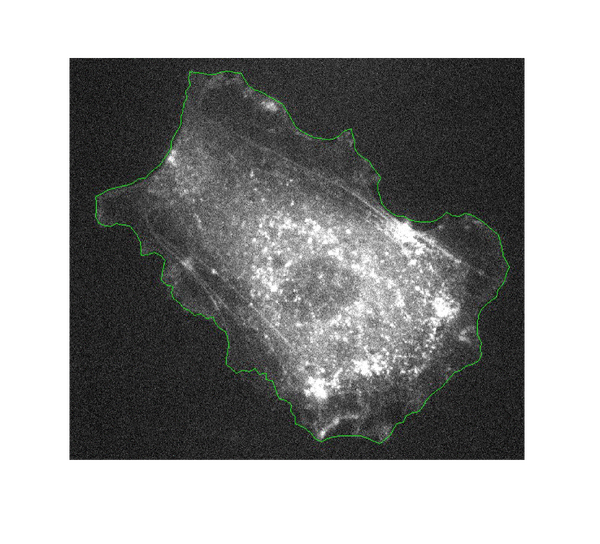
Automatic segmentation and tracking of biological objects from dynamic microscopy data is of great interest for quantitative biology. A successful framework for this task are active contours, curves that iteratively minimize a cost function, which contains both data attachment terms and regularization constraints reflecting prior knowledge on the contour geometry. However the choice of these latter terms and of their weights is largely arbitrary, thus requiring time consuming empirical parameter tuning and leading to sub-optimal results. In [ Pecreaux et al. 2006]. we report on a first attempt to use regularization terms based on known biophysical properties of cellular membranes. The present study is restricted to 2D images and cells with a simple cytoskeletal cortex underlying the membrane. We describe our new active contour model and its implementation, and show a first application to real biological images. The obtained segmentation is slightly better than standard active contours, however the main advantage lies in the self-consistent and automated determination of the weights of regularization terms. This encouraging result will lead us to extend the approach to 3D and more complex cells.
At cell scale and in 3D
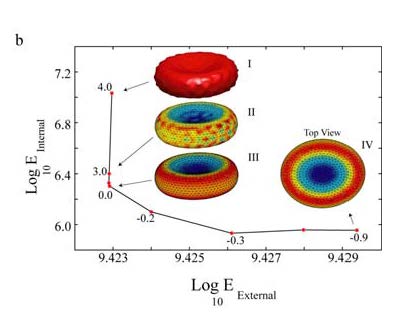
In collaboration with K. Khairy, postdoc (at that time) in the lab of J. Howard (MPI-CBG, Dresden, Germany), we wished to pursue the work on active contours by extending them to the detection of 3D objects. Motivation was twofold: first, to address the issue of balancing automatically data-link and regularization terms; second and more practically, to enable an accurate detection of red-blood cells contour, to enable us to understand what set their shape (this was the project of two postdocs in J. Howard’s laboratory: K. Khairy and J. Foo).
To extend our active contours to 3D, we opted to represent the shape of the contour not as a set of points but by a weighted sum of base shapes (spherical harmonics). Such an approach enabled us to have a more compact representation of the shape by discarding small details. Consequently, it is more efficient for performances of computations. We also proposed a semi-automated method to balance the weight given to data-link (how close we are of the noisy data) and the use of the priors (how well we fit with the low tension / low curvature / ... priors). This method, exposed in [ Khairy, Pecreaux and Howard 2007 ] plots the mismatch of each of these two “constraints” (termed energies) when detecting the contour with various value for the balance parameter (lambda). The resulting curve had an L shape (giving name to the method) and the corner was the optimal balance. Such a method was successful in detecting simulated and real red blood cells (Khairy et al., 2010; Khairy et al., 2007b). This approach offered an easy guess of all parameters. A patent was filled based on this method (Khairy et al., 2007a). One should however notice that this method is limited to a single objects.
At tissue scale
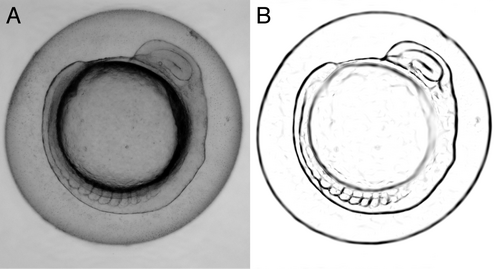
In this last step of the biophysically motivated active contours, we pursued two motivations: first, on the image processing side, we aimed to extend the approach to multiple objects; second, and on the tools for biology side, I aimed to quantify in a non supervised way the development of the zebrafish embryo, during my postdoc in A. C. Oates lab. This study relied on the analysis of the dynamics of appearance of patterns (called somites) currently done on brightfield images, manually and frame by frame. Brightfield images have a low contrast and thus prevent classic image processing analysis to be performed. It is of high relevance to be able to analyze them in an unsupervised way. I thus aimed to enhance (contrast) specifically the images of the somites taking advantage of their known and specific mechanical properties. This involved extending the approach first targeted to cell toward tissues. The second challenge was to detect multiple objects (somites).
To do so, I noticed that tension and bending modulus remain good descriptors of the mechanics of somites, although the values of the parameters measured in tissues differ from the ones in cells (Lecuit and Lenne, 2007; Mchenry et al., 1995; Schotz et al., 2008). To detect multiple objects, I opted for the so-called level-set approach (Osher and Fedkiw, 2003). In this approach, the segmentation of the image (i.e. the distribution of pixels between the various objects or the background) is represented as a landscape. All pixels with an altitude higher than 0 belong to an object and the one below 0 to the background. The level-set at altitude 0 gives the contour of the objects. Such an approach was proven more efficient (Osher and Fedkiw, 2003). The alternative would have been an approach were all objects are represented by a set of points (parametric) but this would have meant that the algorithm must “cluster” the points into object... a tedious task. This new approach enabled us to successfully detect the somites on zebrafish embryo in brightfield micrographs. This method paves the way towards a fully unsupervised segmentation of images of tissues and organisms.
