Life Cycle Assessment
introduction
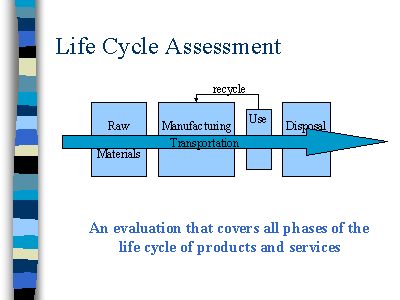
Life Cycle Assessment (LCA) involves evaluating the environmental effects of a product, process, or activity, by looking at the entire life cycle of the product or process from raw materials extraction (i.e. mining, cutting) through consumer use including the impact it might have as waste at the end of its life.

As such LCA is part of a wider field of environmental management, and is also related to Sustainable Indicators and other methods that try to determined the detailed or accumulated anthropogenic effect on the environment.
Methodology
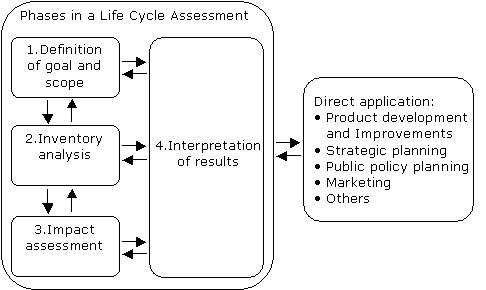
As LCA is a standardized analysis (ISO) it has several fixed stages that are required (though the analysis is not linear):
1. Goal and scope definition.
2. Inventory analysis.
3. Impact assessment.
4. Interpretation.

Briefly, the first stage involves asking the basic questions about the product to be examined and determining the goal. In this phase the functional unit, the reference flow, the product system(s) and its boundaries are determined; The inventory analysis (termed LCI - Life Cycle Inventory) includes mapping the product life cycle by breaking it into its components (unit processes) qualitatively and then quantitatively and determining the economical and environmental inflows and outflows. Next step includes drawing a flow diagram. All processes are reported in their characteristic quantities. Thus, the processes must be scaled to the actual quantities needed for the product system studied (functional unit).; The Impact assessment stage (LCIA) consists of aggregating the environmental outflows using predetermined indicators (e.g Ecoindicater 99) into standard categories (e.g. "Acidification"), using steps of categorization, characterization, normalization and grouping. The interpretation phase is conducted for analyzing and interpreting results. It consists of evaluating the results, analyzing them and drawing conclusions including recommendations (such as what process units to change to reduce environmental impact). For a more thorough description look here [1]
Mathematical base
Conducting tables and inventories, flow charts, aggregation of data and stability analysis checks (for checking environmental impacts of data uncertainties) has led to the formulation of mathematical tools for LCA. One of the more interesting formulation is LCA in matrix form. Look under Reinout Heijungs articles and book [2]/
EIOLCA
Thorough life cycle analysis of products or services has several limitations: it's expensive to conduct; for large products the analysis is highly complex; the data needed is difficult to obtain; and setting the 'boundary' of the analysis is controversial. Often simple methods are sought. Of the difference approaches for analyzing a life cycle the input output approach is the most widely accepted [1]. The input-output analysis technique that forms the basis of the economical input output LCA (EIOLCA) was developed by Wassily Leontief [2]. In this approach the interrelationships between sectors of an economic system are sought, enabling identification of direct and indirect economic inputs of purchases. This concept was extended by including data about environmental and energy analysis from each sector to account for supply chain environmental implications of economic activity. As such it is a tool to examine the ecological footprint of a product or a service. We start up here:
[math]\displaystyle{ x_i=y_i+\sum_{j}{X_{ij}} }[/math]
where [math]\displaystyle{ X_{ij} }[/math] represents the average monetization flow from sector i (row) to sector j (column) in a given year and [math]\displaystyle{ y_i }[/math] is the demand from sector i (i.e., the amount of output purchased for consumption, as opposed to purchased by other sectors), therefore the total output [math]\displaystyle{ x_i }[/math] from sector i includes output to consumers plus output sold to other sectors. In matrix notation [1] assuming [math]\displaystyle{ X_ij }[/math] is normalized such that [math]\displaystyle{ A_{ij}=X_{ij}/x_j }[/math]
[math]\displaystyle{ x=y+Ax }[/math]
==> [math]\displaystyle{ x=(I-A)^{-1}y }[/math]
with knowing only the final demand from each sector [math]\displaystyle{ y }[/math] and the normalized yearly averaged input output matrix , one can calculate the total implied production x from each sector of the economy. The next step involves turning matrix [math]\displaystyle{ A }[/math] from units of dollars to environmental impact by multiplying it with a diagonal matrix with units of impact/$ where each non zero element is the impact of each sector per dollar. Total additional emissions [math]\displaystyle{ \Delta b }[/math] associated with additional final demand of [math]\displaystyle{ \Delta y }[/math] can then be calculated as:
[math]\displaystyle{ \Delta b=R^T(I-A)^{-1}\Delta y }[/math]
The input-output method assumes that the complicated interactions within an economy can be approximated by proportionality relationships [3]; for example by doubling the production of a merchandise (output) a doubling in the resources (input) is required. As such the input-output model can be likened to first order Taylor series approximation to the real-life more complicated relationships; and any small change around an averaged value can be expected to have a linear response.
Case Studies
- Examining the LCA of tap water compared to bottled mineral water revealed that the environmental impact of tap water is less than 1 percent compared to mineral water [3]. Look here for a testimony in front of the American Senate about the differences between tap and bottled water [4].
- Summary of food consumption by the Food Climate Research Network (FCRN) based on LCA [5].
- The surprising comparison between paper, plastic or reusable cup [6] and [7]
- Disposable diapers vs. cloth diapers. It seems that the choice is very much depended on geographical factors such as climate (scarcity of water, dry conditions), land issues (are there landfill problems?) and there is no clear-cut preference. But the debate is ongoing. Look here: [8] and [9].
- LCA of Hand Dryers vs. Paper Towels [10]; the dryer is greener with a lower environmental impacts in all fields except resource depletion.
- LCA of light bulbs reveals that incandescent light bulbs require 5 times more energy than compact fluorescents and LED lamps throughout their entire lifecycle [11].
Investigating Natural products
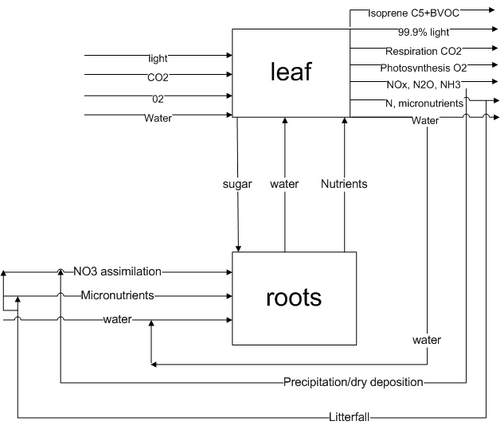
We set out to conduct a LCA of a tree. For one, it is a natural product of nature and to our knowledge has not been assessed; Second, as trees are often considered as having a positive impact on the environment how would their LCA results align with this basic notion? For example, a negative impact might render the LCA methodology as inexact or maybe our understanding of trees - thus LCA of natural products can reveal a lot about natural processes and LCA methodology. Thirdly, with the green agenda in full swing, many people use trees to offset their carbon footprint. Maybe a more accurate analysis of trees can give a more clearer picture to this offset and can help compare other consumer products' impacts to trees (for instance, planting a tree can offset one production of a computer) and thus assist in green and thoughtful consumerism. A fourth and important reason is that data of natural processes is often more readily available than industrial and can make the cumbersome process of gaining the data easier. Below is a chart diagram of a LCA of a tree:

Sustainable consumption, eco products and eco efficiency
Sustainable consumption was put forward by the 1992 United Nations Conference on Environment and Development in Rio de Janeiro. Nowadays, the drive for sustainable consumerism is an international effort by the UN, governments and private sectors. The term 'eco-efficiency' was first coined in 1992 by the World Business Council for Sustainable Development (WBCSD)[12], a coalition of 200 companies from different industrial sectors. It refers to the concept of creating more goods and services with fewer resources and with less waste and pollution. In general, it can be defined as the product services of a certain product divided by its environmental burden.
- The WBCSD initiative of eco efficiency measuring is found here [13].
- The development of tools (eco efficiency, X factor) by the Japanese industry to mark the environmental load of a specific product using its values of performance and life cycle as well [14], [15] and [16].
The GreenHouse Gas (GHG) and Resource efficiency are formulated by:
[math]\displaystyle{ GHG factor= \frac{Product Performance*ProductLifeCycle}{GHG emissions} }[/math]
[math]\displaystyle{ Resource Factor = \frac{Product Performance*ProductLifeCycle}{Resources To Be Inputted+Resources To Be Wasted} }[/math]
The X factor is basically a measure of the change in factors' efficiency of a certain product and is used to evaluate the improvement of a product in terms of its environmental load compared to another product or to the same product in a previous version.
The resource factor can be broken up to all the resources that that specific product used, say water, wood, and metals. combining the GHG factor and an Energy efficiency factor [17] we can place an eco-price for a product. Since the high value of eco efficiency mark 'good products' we will take their reciprocal value to turn into price; thus the lower the e-price (ecost) the better this product is to the environment.
[math]\displaystyle{ ecost = 100*\sum_{n=1}^{Resources} \frac{1}{Resource Factor}+100*\frac{1}{GHG factor}+100*\frac{1}{Energy Factor} }[/math]
Usually the GHG factor is a good indication of the amount of energy used (Energy efficiency), but for instance in countries like France where much of the energy is nuclear the GHG and the Energy factor are unconjugated.
- Green computing - the process of defining the efficiency of computing resources in terms of their ecological footprint [18]
References
-
EIOLCA at wikipedia EIOLCA at wikipedia
-
Leontief, W., 1970. Environmental repercussions and the economic structure: An input-output approach. Rev. Econ. Stat. 52, 262-277
-
Economic Input-Output Life Cycle Assessment of Asphalt versus Steel Reinforced Concrete for Pavement Construction, Noellette Conway-Schempf, Carnegie Mellon University, Pittsburgh [1]
Links
- ESU - renowned consultant firm, many info, articles, and case studies
- UNEP initiative on LCA
- The Green design Institute at Carnegie Mellon university, Pittsburgh
- ecofx - information on LCA products
- sustainability on geographic maps
- culture climate - social network linked with sustainability
- T-factor ecost of products
- WBCSD report on consumption
- Food Climate Research Network
- Earthster
- EPD & climate declarations
Programs
% MBDC's Design Paradigm models human industry on natural processes
Journals
--Alon Shepon 05:25, 5 March 2009 (EST)