Jasieniuk:Converting codominant to dominant data
Overview
In polyploid species, codominant markers such as microsatellites become essentially dominant, because allele copy number is usually not known. Some programs such as STRUCTURE 2.2 can handle polyploid codominant data. However, for applications such as parentage analysis or quick visualization of data by Principal Coordinate Analysis or UPGMA, it is useful to recode each codominant allele as a dominant marker.
Note: This can now be done in the R package polysat as well.
Materials
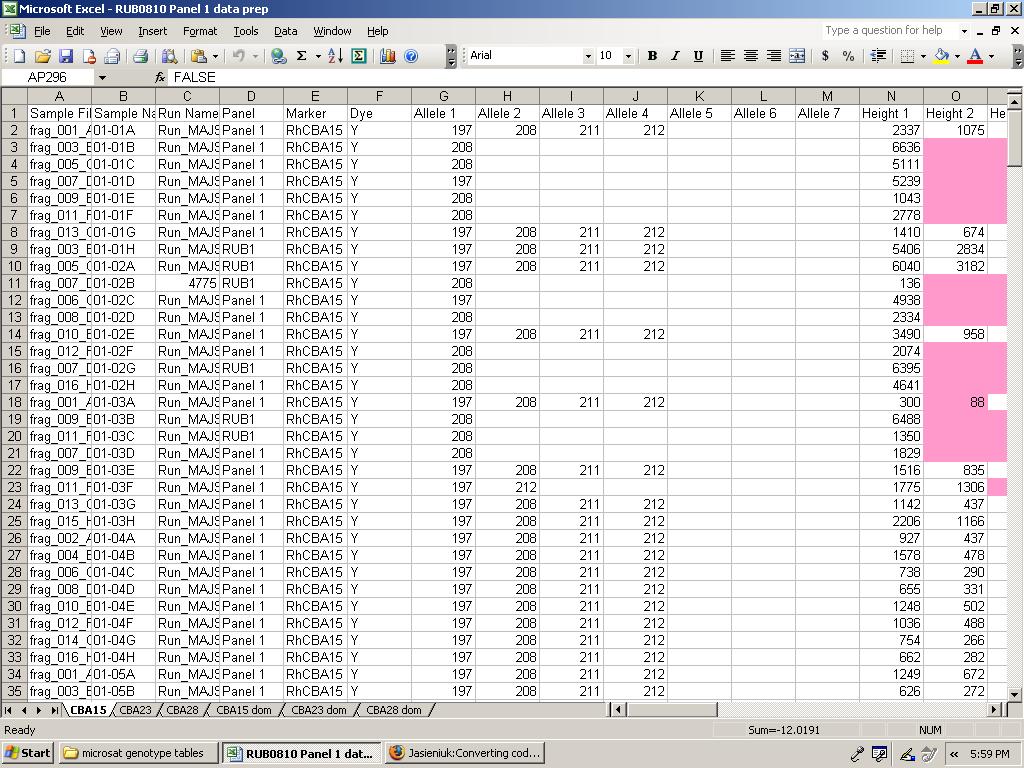
- Codominant allele-calling output, such as that produced by ABI GeneMapper, in which all alleles for an individual for a given marker are listed in one row.
- Microsoft Excel
Procedure
- Cut and paste the data so that each microsatellite marker has its own worksheet. You might also want to have multiple Excel files, for example one file per microsatellite panel, in order to avoid monstrously large files.
- Retain the following columns:
- Sample Name (so you have an index of your individuals)
- Run Name (so you can go look up the original data if anything comes into question)
- Alleles
- Height (or your favorite measure of allele quality)
- Anything else that you need in order to feel comfortable, for example Panel and Marker to make sure you haven't pasted the wrong data into the wrong worksheet.
- Sort each worksheet by sample name. (For the less Excel-savvy, click the gray rectangle just to the upper left of the worksheet to highlight the whole sheet, then go to Data-Sort.) Each worksheet should have the same list of sample names (individuals). Each individual should be on the same row on each sheet. When I'm filling in holes in the data, I just paste the new rows of data over the old, so that I still have just one row per individual.
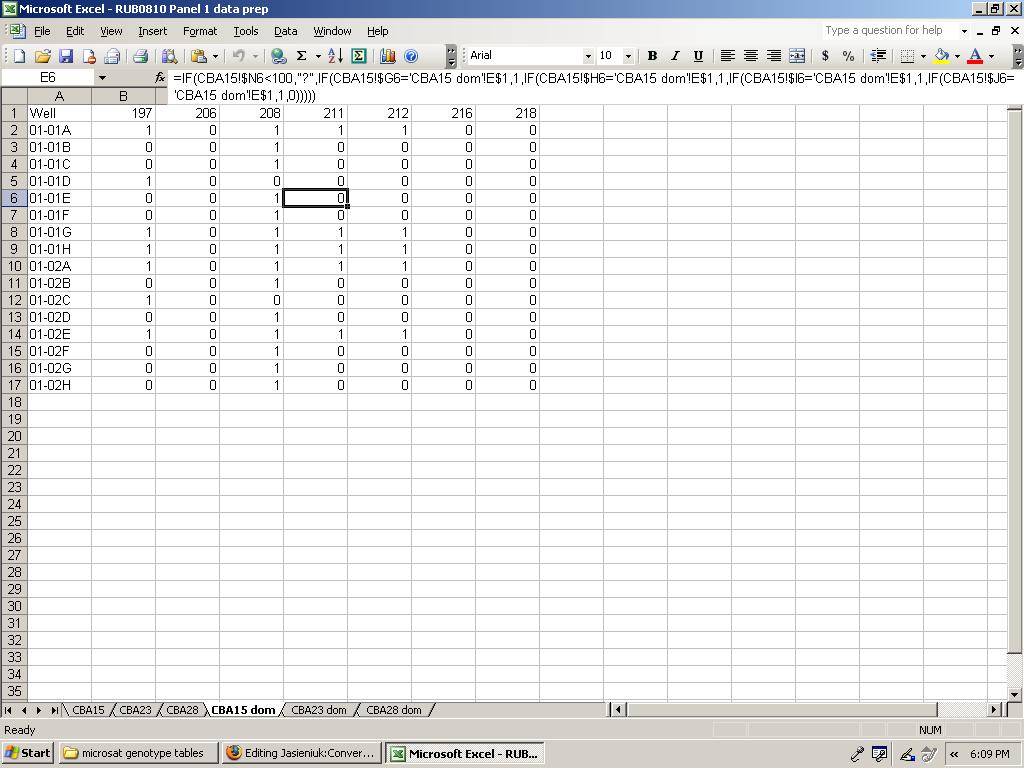
- Make a new worksheet for each microsatellite marker. Starting in cell
B1and going across row1, list each unique allele for that marker. I list them from smallest to largest so that I can easily check to see if I've already listed an allele. - In column
Aof these new worksheets, starting inA2, list all of your individuals. I find it easiest to just write a formula to retrieve the data from the Sample Name column on the codominant data worksheets. (For example, if your codominant data is in a sheet calledABC1, and your sample names are in columnBon that sheet under a header row, then in the new sheet, in cellA2, you would write=ABC1!B2, then click and drag to fill in the rest of the column.) - Here's the magical time-saving part. In cell
B2of this worksheet, you're going to write a formula that will put a1in the cell if that individual has that allele, a0in the cell if it doesn't, and a?(or missing data symbol of your choice) in the cell if that individual has poor data quality for that marker. And you can drag that formula across and down the whole worksheet to fill it all in. I use nestedIFstatements to first check if the marker quality is acceptable, then check each column for the presence of the allele.- Let's say that in your worksheet of codominant data (which we'll call
ABC1), you have four allele columns,FthroughI, and the peak height for the allele in columnFis in columnJ. And let's say that if the first peak height is less than 100 (or if there's no data in the row), you want to mark the data as missing. We'll also assume that you have a header row, so your data starts in row 2. In cellB2of the new worksheet (which has all your alleles across the top row, and all your individuals down the left column, and which we'll callABC1dom), you will write: =IF(ABC1!$J2<100,"?",IF(OR(ABC1!$F2=ABC1dom!B$1,ABC1!$G2=ABC1dom!B$1,ABC1!$H2=ABC1dom!B$1,ABC1!$I2=ABC1dom!B$1),1,0))- Click and drag to fill that formula across the row, then down to the last individual. It should change automatically to reference the correct cells. Visually check to see that the dominant data being generated matches your codominant data.
- Let's say that in your worksheet of codominant data (which we'll call
- Copy everything in the worksheet, then paste the values (under Paste Special) into a new spreadsheet file. You can paste the dominant data from multiple markers side by side (checking to see that the sample names match up) to make one big table with all of your dominant data. At this point I usually alter the allele names to indicate which marker they came from. (This can also be done with a simple formula. Insert a new row, then write
="ABC1-"&B2(for example), drag it across, then copy and paste the values to make it something can be read if the table is converted to a text file.)
Screen Shots
Notes
The original formula was
=IF(ABC1!$J2<100,"?",IF(ABC1!$F2=ABC1dom!B$1,1,IF(ABC1!$G2=ABC1dom!B$1,1,IF(ABC1!$H2=ABC1dom!B$1,1,IF(ABC1!$I2=ABC1dom!B$1,1,0)))))
but then I remembered that I'd come up with a shorter version. *Lindsay V. Clark 20:04, 12 November 2008 (EST):
Other missing data symbols might be more useful depending on what program you're using, for example if you wanted missing data represented as 999, the formula would begin =IF(ABC1!$J2<100,999,IF(OR(...
Please feel free to post comments, questions, or improvements to this protocol. Happy to have your input!
- List troubleshooting tips here.
- You can also link to FAQs/tips provided by other sources such as other websites or programs.
- Anecdotal observations that might be of use to others can also be posted here.
Please sign your name to your note by adding '''*~~~~''': to the beginning of your tip.
Contact


