ISEEM AnnualReport2009
1. GRANT OUTCOMES, OUTPUTS & ACTIVITIES
To the best of your ability, please address progress towards achieving each Outcome and Output listed below. In particular, please describe how progress towards accomplishing each Activity culminates in progress towards achieving a given Output. Mark the approximate percent complete for each Output. Also, in the appropriate space please describe how, in aggregate, the progress towards achieving these Outputs culminates in progress towards achieving the Grant’s Outcome.
Outcome1, Output 1: Characterize metagenomic microbial biodiversity and biogeography from CAMERA data.
1.1 Guidelines and weightings for using different gene families in metagenomic based diversity assays (Eisen).
1.1a. Generate alignments and trees for targeted set of 50-100 gene families; Deliver trees to projects 1b, 1c, 1d, 2a, and 2b; Generate scores for targeted set of 50-100 gene families; Test utility of scores using simulated and real metagenomic data sets.
- 90% complete
As reported in last years, annual report, much of the work in this area was completed with the main challenge/limitation being in determining exactly how to make phylogenetic trees where metagenomic data was included for different gene families. This challenge has now (finally) been effectively solved by the combined work of Martin Wu, Steve Kembel (Green Lab) and Thomas Sharpton and Sam Reisenfeld (Pollard) lab who have each developed methods for phylogenetic analysis of metagenomic data.
The work led by Kembel is described in section 1.3
The work lead by Sharpton and Reisenfeld is described in Section 2
Martin Wu's work on improving our ability to carry out phylogenetic analysis involved the development of the Zorro tool for making automated sequence masks from alignments of gene families. This was described briefly in last years annual report. Information from the previous quarterly report is also included below
Guillome Jospin, the new Bioinformatics Engineer, is now working with Sharpton and Morgan Langille and Dongying Wu, to build phylogenetic trees for all gene families of interest. In addition, Sam Riesenfeld has been working on simulating metagenomic sequences which will then allow us to test the phylogenetic methods of Sharpton and Kembel to see how they perform on different types of data.
More on Zorro:
- The quality of multiple sequence alignment may have a large impact on the final phylogenetic tree. Marking and removing the ambiguous regions of the alignment, a step known as masking and trimming in phylogenetics, can be beneficial, especially for divergent sequences that are difficult to align. Traditionally, this was done by manual curaton, which has simply become infeasible for genome-level phylogenetic analysis. In AMPHORA, we used masks embedded with the Hidden Markov Models of the protein families to automate the masking and trimming process. The mask, although needs to be generated only once for each protein family, still relies on skilled but sometimes arbitrary manual curation. Recently, we developed a probability-based algorithm named Zorro to assess the quality of the alignment and use it to mask the regions of uncertainty. Previously we have shown that Zorro outperforms Glbocks in both specificity and sensitivity (Gblocks is a program that masks alignments based on the conservation score of each column in the alignment and a set of ad hoc rules).
- Since trimming could in theory remove phylogenetically informative sites, we tested whether trimming by Zorro actually led to better phylogenetic trees. In a simulation study, we subjected multiple sequence alignments to three different treatments: no trimming, trimming by Zorro or trimming by Gblocks. We then reconstructed neighbor-joining and maximum likelihood trees and measured the accuracy of the trees by calculating their Robinson Foulds topological distances to the true tree. To test the relative performance of trimming, we also permuted the alignment length, tree shape (symmetric vs. asymmetric) and the degree of divergence of the protein sequences. For each unique permutation, 200 simulations were run and the average Robinson Foulds distance was calculated. A total of 8,000 trees were estimated and compared. The results are shown in the figure.
- Our simulation study shows that trimming by Zorro or Gblocks significantly improves the phylogenetic trees when the sequences to be compared are relatively divergent (Figure panel A and C). Trimming decreases the topological distances to the true tree with respect to the complete alignment. This is most likely due to increased signal-to-noise ratio after elimination of problematic regions. For the complete alignments, the signal-to-noise ratio stays the same and the neighbor-joining trees estimated from them do not get better with the increasing alignment length. The improvement in phylogenetic accuracy is most pronounced in the neighbor-joining trees of the relatively divergent sequences. Maximum likelihood trees also benefited from trimming, but the impact was smaller. This is because the maximum likelihood method can accommodate to a certain degree the evolution rate heterogeneity and extract some useful phylogenetic information from the difficult to align regions that are removed from the alignments. Alignment length is also an important factor to consider. Short alignments in general benefit less from trimming than longer alignments, because the loss of informative sites offsets the gain of the signal-to-noise ratio to a larger extent in the shorter alignments. This suggests that for phylogenomic studies, when sequences from multiple genes are concatenated to generate "mega-alignment", trimming should always be carried out to obtain the best phylogeny possible.
- Figure shows that Zorro outperforms Gblocks in terms of improving the phylogenetic accuracy. Gblocks uses the conservation score of each position and a set of rules (e.g, the maximum number of contiguous nonconserved position is 8) to distinguish conserved blocks from highly divergent regions. However, different protein families have different functional or structural constraints and no single set of rules will fit all the proteins equally well. In addition, these rules are ad hoc and there seems to be little theoretical basis behind them. Therefore, Gblocks might remove too much information from the alignments. As a result, in some cases trimming by Gblocks actually shows detrimental effects on the final trees.
- For sequences of less divergence, trimming does not seem to help (Figure panel B and D). This is expected because aligning these sequences is no longer an issue and the percentage of alignment that are trimmed is relatively small. We note that under no circumstances we have tested here, trimming by Zorro ever led to significant worse phylogenetic trees. Therefore, trimming by Zorro seems to be justified for phylogenetic inferences, especially of deep relationships such as these among the major bacterial lineages. Because of its speed, neighbor-joining is often chosen over the maximum likelihood method for large-scale phylogenetic analyses. Our study suggests that trimming leads to significant better neighbor-joining trees and therefore should be used in these phylogenomic studies.
- We are in the process of finishing up writing the manuscript and we expect to publish the results soon.

1.1b. Generate alignments, trees, and scores for expanded set of ~500 families; Test utility of these scores using simulated and real metagenomic data sets.
- 90% complete
- As with the previous section, the work in this area was initially somewhat limited by the challenges with inferring phylogenetic trees for metagenomic data.
- Below we provide a summary of the efforts of Dongying Wu (Eisen lab) and others in building alignments and analyzing them for 1000s of protein families.
In order to build gene families for all archaeal and bacterial genomes, we started from 15 archaeal and 85 bacterial genomes. The 100 organisms were selected so that phylogentic diversities (PD) are maximized. The PD calculation for archaea was based on a radA tree while for the bacterial PD was based on a maximum likelihood tree from concatenated alignments of 31 phylogenetic markers. All vs all blast searches were performed for the peptide from the 100 genomes followed genome family building by MCL clustering. As a result, 17232 families were built.
From the bacterial genomes, we’ve identified 25 new phylogenetic markers candidates as a result. The 25 new marker candidates are selected because they are evenly distributed across the genomes and each genome only has a single copy of the gene. Phylogenetic tree building and tree topology comparisons indicate that the 25 novel markers are as good as the 31 AMPHORA markers to study the bacterial phylogenies. (see Figure DW1).

We’ve also built HMM profiles for 502 bacterial families that appear in more than 70% of the 85 representative bacterial genomes (ready for download from http://bobcat.genomecenter.ucdavis.edu/mfam/bactFam.tgz). Such universally distributed families not only contains more potential phylogenetic markers, but they are immediately useful for filtering out proteins in large families such as ABC transporters that are obstacles for family building on a larger scale. As we demonstrated in Figure DW2, the 502 bacterial families are only 3% of all the bacterial families we built, but involve 25% of the genes and 82% of BLASTP links for family building. Filtering out the universally distributed genes is a vital step for gene family classification for large-scale metagenomic gene family building.

We’ve established a protocol to identify automatically phylogenetic marker candidates for any given phylogentic groups. The protocol uses BLAST and MCL clustering algorithms to generate gene families for a given group of genomes. Phylogenetic trees are built for the gene families and clades from the trees are automatically sampled and evaluated for universality and evenness in terms of their distributions. HMM profiles are built for the clades with genes distributed across the organisms with a single copy in each genome. HMM searching against the entire proteome of the group is applied to evaluate how distinct the gene families are. We’ve build distinct single-copied gene families that evenly distributed within a phylogenetic group (we’ve studied the archaeal domain and 10 bacterial phyla). HMM profiles were built for 5133 families that can be potential markers for the lineages of interest (See table DW1). Clustering and tree building analysis of the consensus sequences from all the families reveals that we can identify 62 gene markers that each span archaea and at least 2 bacteria phyla, as well as 324 bacterial gene markers that each covers at least 4 phyla. We are in the process of studying the distribution of the ~300 marker candidate across all sequenced genomes as well as the topologies of the phylogenetic tree built from them to establish a marker database for phylogenomic and metagenomic studies.
Table DW1. Universal single-copied genes for different phylogenetic groups
Phylogenetic group	Genome Number	Gene Number	Maker Candidates
Archaea                62              145415          106
Actinobacteria         63              267783          136
Alphaproteobacteria    94              347287          121
Betaproteobacteria     56              266362          311
Gammaproteobacteria    126             483632          118
Deltaproteobacteria    25              102115          206
Epislonproteobacteria  18              33416           455
Bacteriodes            25              71531           286
Chlamydae              13              13823           560
Chloroflexi            10              33577           323
Cyanobacteria          36              124080          590
Firmicutes             106             312309          87
Spirochaetes           18              38832           176
Thermi                 5               14160           974
Thermotogae            9               17037           684
1.1c. Integrate scores with development of diversity assays.
- Status: 10% complete
- Work is in progress in how to make use of these scores to improve some of the diversity assays. We have, for example, begun to analyze variation in copy number of genes across the tree of life. Kembel and Wu are working on a method to use the existing (i.e., known) variation in copy number to predict the copy number for different organisms based upon where their gene sits in the phylogeny relative to organisms with known copy number.
1.1d. Create and update database of score for different genes and integrate database into CAMERA.
- Status: 0% complete. We are waiting on the integration into CAMERA of AMPHORA, STAP and other tools developed in our group before the database on gene family scores can be made into a useful component of CAMERA. The database is available, it is just not feasible at this time to provide it to the community through CAMERA since the other parts of the analysis are not currently available.
1.2 Searching for novel phylogenetic types in metagenomic data (Eisen).
1.2a. Develop an automated system for novel branches using rRNA sequences in metagenomic data.
- 100% complete.
- One version of the this is described in previous reports and is in the STAP paper by Wu et al.
- A second version is in a manuscript in preparation by Dongying Wu and Jonathan Eisen. For more information see section 1.2c
- A third version of this is embedded in the work being led by Tom Sharpton described in Section 2.
1.2b. Integrate methods into CAMERA.
- Status: In progress
- Methods have been provided to CAMERA for doing this type of analysis (e.g., the STAP software package) but are not yet fully integrated into CAMERA for reasons beyond the control of this project.
- We note, the STAP software is available for free and links are provided in the paper, and on the iSEEM and Eisen lab web sites.
1.2c. Develop an automated system for searching for novel branches for protein coding genes.
- 100% complete.
One version of this is described in previous reports and is in a manuscript in preparation by Dongying Wu and Jonathan Eisen. In this paper, we describe the development of methods to scan through large metagenomic and genomic sequence data sets for sequences that fall into novel deep branches in a phylogenetic tree. We build data sets of all RecA and RpoB genes in genbank to serve as reference sequences. Gene families were built for GOS RecA homologs with RecA reference sequences using BLASTP followed by lek clustering algorithm. Representatives from each family were selected and a maximum likelihood tree was built. Based on the subfamily clusters and the tree structure, we’ve identified 15 major RecA groups. 5 novel deep branching groups included only GOS sequences at the time of initial analysis. With the additional help of neighboring gene studies of the metagenomic assemblies, we identified the novel RecAs as recA SAR1, phage SAR2, phage SAR1, a deep-branching archaea and an unknown group. Similar approaches have helped us identifying two novel rpoB groups as well. We demonstrated that using protein phylogentic markers to analyze metagenomic data is a robust and effective way to identify lineages that are still remains to be discovered. We are excited that two of the novel RecA groups (Phage SAR1 and the deep-branching archaeal group) were subsequently verified by other researchers.

A second version of this is embedded in the work being led by Tom Sharpton described in Section 2.
1.2d. Identify novel branches for each gene family; Identify other genes linked to genes identified as novel; Develop a Unifrac-like system for identifying the amount of novelty in metagenomic data for a particular gene family; Compare the novelty of phylogenetic marker gene families versus functionally important families; Compare analysis of gene family novelty with metagenomic sample metadata to determine if any types of environments are enriched for novelty.
One way of characterizing functional novelty is to search for novel protein subfamilies that are revealed by analysis of metagenomic data. The most statistically rigorous automated subfamily identification tool produced to date is SCI-PHY (Sjolander), which references a gene family phylogeny to cluster sequences into subfamilies. Unfortunately, the current implementation of SCI-PHY is inappropriate for metagenomic data because it only considers a neighbor-joining tree constructed at run time in a manner ill-equipped for handling short, non-overlapping sequences. We have begun modifying the open source SCI-PHY package to enable its accommodation of our high-quality metagenomic-read inclusive phylogenies. Once completed, we will use SCI-PHY to screen gene family trees (section 2.1a) for subfamilies comprised solely of metagenomic sequences. Tom Sharpton is leading this project.
1.2e. Integrate methods into CAMERA.
- Status: In progress
- We continue to try to work with CAMERA but continue to have challenges in moving from initial discussions to having CAMERA develop workflows from our tools.
- We note, the AMPHORA and Zorro software is available for free and links are provided in the paper, and on the iSEEM and Eisen lab web sites.
1.3 Metagenomic analysis of community phylogenetic structure (Green)
1.3a. Metagenomic community phylogenetic analysis of rRNA genes.
- Status 90% complete
Using the SSU rRNA gene identification and alignment pipeline described in section 2.1a, we have carried out community phylogenetic analysis based on 16S SSU rRNA reads identified from metagenomic data sets including HOT/ALOHA and GOS. We are analyzing these data in the context of the larger community phylogenetic analysis of gene families identified in 1.1a (see section 1.3b below for details of progress), and finding that SSU rRNA genes and the phylogenetic marker genes described in section 1.1a give concordant results when used to study community phylogenetic structure. This suggests that the use of phylogenetic marker genes with metagenomic data will give comparable results to traditional SSU rRNA gene based analyses of microbial community structure, and will dramatically increase the size of phylogenetic marker gene community data sets that can be derived from metagenomic data.
As described below, the HOT/ALOHA analysis is in review [Kembel, Pollard, Eisen, Green].
1.3b. Metagenomic community phylogenetic analysis of all 50 gene families identified in 1a.

- Status 75% complete
Analysis of community phylogenetic structure requires a phylogenetic hypothesis for the sequences or organisms living in a community. Construction of phylogenetic trees linking sequences in metagenomic data sets has been limited by the fragmentary, non-overlapping nature of metagenomic reads. We developed a novel approach for community phylogenetic analysis of metagenomic data based on combining the phylogenetic marker gene identification and alignment methods for metagenomic data along with reference data sets of full length gene sequences from fully sequenced microbial genomes described in section 1.1.
Our initial analyses using this approach focused on describing phylogenetic diversity in bacterial communities in the HOT/ALOHA data set. We quantified phylogenetic diversity and turnover of communities along the oceanic depth gradient sampled by this study based on a combined analysis of sequences from the 31 phylogenetic marker genes included in AMPHORA (section 1.1b). These analyses revealed that while bacterial taxonomic diversity (number of 16S rRNA OTUs) did not vary with depth, bacterial phylogenetic diversity (evolutionary branch length present in communities) peaks at intermediate ocean depths, and that bacterial communities in the photic and non-photic zones contain phylogenetically distinct communities. These results are in review [Kembel, Pollard, Eisen, Green].
Ongoing analysis is applying this general approach to analyze microbial community structure in the GOS data set on CAMERA. Initial results are based on the 31 phylogenetic marker genes included in AMPHORA but we are currently extending these analyses to include the larger set of gene families and universal single-copy genes identified in section 1.1. We asked how phylogenetic diversity varies along environmental gradients in the ocean, and the relative importance of space and environment in determining phylogenetic turnover in these communities. Preliminary results indicate that salinity and habitat type (e.g. open ocean vs. coastal waters) are the factors that explain most of the variation in phylogenetic diversity and turnover in oceanic bacterial communities.
We will integrate our results with the analysis of taxonomic diversity (based on SSU rRNA gene; section 1.4b) and functional diversity (based on functional protein diversity; section 2.1) in order to understand the relationships between these different aspects of diversity. Our development of methods to identify sequences from SSU rRNA, phylogenetic marker gene, and functional gene families simultaneously from metagenomic data will make it possible for the first time to understand the full spectrum of biological diversity (taxonomic, phylogenetic, and functional diversity) based on metagenomic data.

1.3c. Assess utility of gene families from community phylogenetic perspective.

- Status 75% complete
A challenge of comparing phylogenetic hypotheses for the same metagenomic data set based on different gene families is that the organisms from which sequences were obtained are unknown; as a result it is not possible to directly compare phylogenetic trees for different gene families. We are assessing the utility of gene families from a community phylogenetic structure perspective by comparing estimates of phylogenetic diversity and turnover obtained from the analysis of metagenomic sequences from different gene families, and comparing patterns of community phylogenetic structure based on separate analyses of individual gene families versus a combined analysis of phylogenetic relationships among sequences from multiple gene families.
As part of our analysis of phylogenetic diversity in the GOS data set based on phylogenetic marker genes (section 1.3b), we contrasted estimates of phylogenetic diversity of environmental samples based on each of the 31 AMPHORA gene families, as well as for SSU rRNA sequences identified from the same data set (section 2.1a). Analysis of these different gene families gave broadly concordant results, with the phylogenetic diversity of different communities highly correlated regardless of the gene family used to estimate phylogenetic relationships. Analyses of the HOT/ALOHA data set indicated that estimates of phylogenetic diversity based on the 16S rRNA gene versus a combined analysis of 31 phylogenetic marker gene families also gave broadly concordant results (see section 1.3a above).
These empirical analyses will combined with simulation studies (section 3.1b) to evaluate the relative utility of different gene families for community phylogenetic analysis, but our results to date indicate that by selecting phylogenetic marker gene families that meet a set of criteria including universality and low copy number, we obtain consistent estimates of community phylogenetic structure across multiple gene families, and it is possible to greatly increase the number of sequences from metagenomic data sets that can be used to quantify phylogenetic diversity versus traditional single-gene marker approaches. Future analyses will include quantifying whether tree topology differences between the AMPHORA genome tree and single-gene trees for marker gene families can be used to weight phylogenetic diversity estimates based on these different gene families.
1.3d. Integrate methods into CAMERA tools.
- Status 0% complete
The methods for community phylogenetic analysis of metagenomic data described in section 1.3 are all implemented in scripts and open-source bioinformatics toolkits that have been or will be made publicly available (i.e. in the picante software package - Kembel et al. submitted to Bioinformatics). These methods have already been designed to work with data sets in the formats produced by the software pipelines developed for other parts of the iSEEM project (i.e. sections 1.1b, 2.1a), and we will work with CAMERA to integrate these tools into analysis workflows at the same time that the other pipelines are being incorporated.
1.4 Estimating biodiversity from metagenomic samples (Green).
1.4a. Assess the fidelity of currently used species (or phylotype) richness estimators.
- Status 100% complete
As noted in our previous annual report, to assess the fidelity of currently used OTU richness estimators, we analyzed the 16S sequence data available on CAMERA for the HOT/ALOHA and GOS data sets. We calculated commonly used OTU richness estimators: the Chao1, Jacknife, ACE, and boostrap. Our results corroborate those reported in Shaw et al. 2008, namely that all statistics yielded qualitatively similar diversity rankings of environmental samples for a given sequence similarity cut-off. Additionally, all the estimators gave qualitatively similar estimates of total richness. In isolation, these results suggest that the majority of OTU richness estimators are useful for ranking microbial diversity among metagenomic samples. But the fidelity of these estimators becomes questionable when considered in tandem with phylogenetic diversity measured across the same samples. As the figure in section 1.3b illustrates, our analysis of taxonomic and phylogenetic diversity in the HOT/ALOHA data set indicates that OTU-based taxonomic diversity estimates did not vary predictably along an oceanic gradient, while phylogenetic diversity showed strong patterns of variation with depth. These findings substantiate our current focus on measures of phylogenetic diversity. However, given taxonomic diversity estimators are a widely used benchmark for comparative analysis of microbial diversity, we incorporated our findings into the manuscript describing metagenomic phylogenetic diversity in the HOT/ALOHA data.
1.4b. Develop and evaluate novel biodiversity estimators geared toward metagenomics.
- Status 75% complete
A basic question in microbial ecology is the extent to which habitat heterogeneity and dispersal limitation affect large-scale patterns of biodiversity. At one extreme, it is possible that most taxa occur everywhere, while on the other extreme, it is possible that the distributions of taxa are highly constrained by environmental conditions and inability to move between locations. Addressing this question has implications for understanding microbial evolution -– whether microbes are primarily adapted to specific niches or cosmopolitan –- and estimating regional to global microbial taxon richness.
Two characteristics of the distributions of taxa particularly bear on this question, taxa-area relationships and the shapes of ranges. Taxa-area relationships describe how the number of taxa occurring in a region increases with the area of that region. Thus, they can also allow regional or global taxa richness to be estimated. The shapes of ranges describe precisely how taxa are distributed: for instance, do they inhabit circular or highly elongate regions? With dynamical models of colonization, information about range shapes can allow strong inferences about the processes underlying microbial distributions.
Unfortunately, it is challenging to infer directly microbial taxa-area relationships and range shapes because censusing microbes in large regions is difficult. For instance, it is impractical to census all microbes inhabiting large volumes of sea water. However, distance-decay relationships can easily be constructed for microbes, and in addition to allowing direct ecological inferences, they can allow taxa-area relationships and range shapes to be inferred. Distance-decay relationships describe how the similarity between between pairs of communities (or samples) decays as a function of the distance between them; naturally, distant communities tend to share fewer taxa than proximate ones. To construct a distance-decay relationship, the taxa in numerous small samples must first be censused. For various subsets of the samples, a measure of similarity is then calculated -- for instance, the number of taxa that the samples share divided by the total number of taxa in the samples -- and this is regressed on the distance between the samples to give the distance-decay relationship. A rapidly decreasing distance-decay relationship suggests strong effects of habitat heterogeneity and dispersal limitation, while a slowly decreasing distance-decay relationship suggests cosmopolitanism.
To make ecological inferences from distance-decay relationships, and infer taxa-area scaling and range shapes from them, a quantitative understanding of how distance-decay relationships arise is necessary. The Green and Pollard labs have been developing and validating two interrelated theoretical frameworks to address this issue. James O'Dwyer and Josh Ladau have been leading these projects.
The Geometry of Taxa Distributions (Josh Ladau, Katie Pollard)
One strand of theory is focussed on understanding the size and shape of ranges of taxa across a spatial environment, and connecting this understanding to taxa-area scaling. Our theory assumes that the distributions of taxa can be approximated by polygons and disjoint points, and that samples are collected at random locations. Under these assumptions, we have proven that the average number of taxa (i) shared between a pair of samples, (ii) unique one sample in a pair of samples, and (iii) occurring in at least one sample vary as a the sum of a quadratic function of distance and a non-quadratic function, all divided by a function of the shape of the region that was sampled. We have also validated our theory using six large data sets. For these data sets, we have found that the observed distance-decay relationships conform remarkably well to the predictions of our theory.
Our approach for using this theory to infer microbial taxa-area relationships is described in the June 2009 Progress Report. To infer shapes of ranges, it can be shown that the quadratic function for the distance-decay relationship has a geometric interpretation. More specifically, a quadratic distance decay relationship means that the average similarity between pairs of sites is given by a0 + a1*r + a2*r^2, where a0, a1, and a2 are constants ("coefficients"), and r is the distance between the sites. If the distance-decay relationship is considered for just a single taxon, then a0, a1, and a2 can be shown to be proportional to the area, perimeter, and angularity of that taxon's range, respectively. Thus, by fitting the quadratic model to observed microbial distance-decay relationships, we can estimate these attributes of the shapes of their ranges.
Individual-based, Stochastic Community Assembly (James O'Dwyer, Jessica Green)
The second strand of theory focusses on the dynamics of individuals, taking into account birth, death, speciation and dispersal across a spatial landscape. This approach was described in the September 2009 progress report, and since then the theoretical framework has been published in a high-profile, specialist journal Ecology Letters, building on a framework developed earlier in 2009 and published in PNAS.
The central results of this paper are: (1) we find a classic power-law relationship over a wide-range of scales, so that taxa richness, T is proportional to a power function of sample area, A^z. This relationship has been observed in hundreds of empirical studies, including both terrestrial and aquatic microbes.
(2) We are able to relate the exponent of this power law, z, to the underlying rate of speciation in a community, alpha, shown below. This same parameter governs distance decay in this model, and so we can use turnover in taxonomic community composition (distance decay) to tightly constrain the form of the taxa-area relationship.

We are currently extending this framework in a number of directions. First, we are taking into account variation of the demographic parameters driving spatial patterns, as these parameters shift with variation in traits and environmental drivers, such as temperature. Adding this additional layer of biological realism may be crucial in applying theory to the full GOS dataset, which now encompasses significant variation in temperature. We are also beginning to integrate into our framework the effect of strong competition among individuals for available resources, to test whether this has a significant impact on large-scale patterns like the taxa-area relationship. Finally, we are seeking to integrate this theoretical framework with the geometrical approach taken by the Pollard lab. We are currently adapting tools from statistical mechanics to relate the dynamics of the shape and size of taxa ranges to the dynamics of the individuals underlying those ranges.
1.4c. Apply diversity estimators to publicly available data.
- Status 50% complete
We have begun applying the theoretical methods described above to the GOS metagenomic data. To accomplish this, members of the Green and Pollard labs have developed a pipeline to estimate microbial diversity from metagenomic data sets (described in more detail below), and we are using this pipeline to characterize distance-decay relationships across the GOS sample sites.
Although our results are preliminary, they suggest that different taxa of microbes differ greatly in their distributions. The next steps in this project are threefold: First, we are working to mathematically prove that the shape estimators are unbiased. Currently, we have done sufficient numerical simulations to be confident in our result; but a rigorous proof remains critical. Second, we are working to finalize the analysis of the GOS data and apply the method to other microbial data sets. Last, we are developing dynamical models to predict the shapes of distributions under various colonization processes; e.g., passive diffusion. Using the shape estimators, we will then test whether the ranges of microbial taxa conform to the predictions of these models. In doing so, we hope to gain insight into the specific processes of microbial dispersal and community assembly.
Outcome 1, Output 2: Identify evolutionary dynamics of microbes in nature as illustrated in CAMERA data.
2.1 Molecular evolution of gene families (Pollard).
2.1a. Develop and evaluate molecular evolutionary methods for metagenomics.
- Status 95% complete
Phylogenetic P-Values
In collaboration with the lab of Adam Siepel (Cornell University), Katie Pollard completed development and testing of a software tool called phyloP, which enables the assessment of unexpectedly slow or fast rates of evolution on different lineages of a phylogeny. phyloP is part of the freely available PHAST package (http://compgen.bscb.cornell.edu/phast/).
Methods for detecting nucleotide substitution rates that are faster or slower than expected under neutral drift are widely used to study the evolution of genomic sequences and to identify functionally important sites from comparative sequence data. However, most previously existing methods consider either reductions (conservation) or increases (acceleration) in rate but not both, or assume selection acts uniformly across the branches of a phylogeny. In a Genome Research publication (Pollard et al, 2009), we examined the more general problem of detecting departures from the neutral rate of substitution in either direction, possibly in a clade-specific manner. We considered four statistical, phylogenetic tests for addressing this problem: a likelihood ratio test, a score test, a test based on exact distributions of numbers of substitutions, and the Genomic Evolutionary Rate Profiling (GERP) test. All four tests have been implemented in phyloP. Based on extensive simulation experiments, these tests are remarkably similar in statistical power. They all appear to be capable of fairly good sensitivity with low false positive rates in detecting strong selection at individual nucleotides, moderate selection in 3 bp elements, and weaker or clade-specific selection in longer elements. The models in phyloP are based on DNA nucleotide sequences.
In the next year, we plan to generalize phyloP to include models based on a codon alphabet to make them more powerful for use on protein sequences.
Profile based classification of metagenomic reads
The general goal of this project is to develop a phylogenomic methodology that will classify, or annotate, metagenomic sequences into gene families. Classified sequences will be used to explore biodiversity, discovery novelty, and describe trait-based community assembly. Methodological development has been primarily undertaken by Thomas Sharpton under the guidance of Katie Pollard and Jonathan Eisen, but has leveraged the multidisciplinary insight available from the iSEEM working group.
Generalized workflow strategy
Phylogenomic annotation is a well documented process, requiring the classification of sequences into homologous families, sensitive and specific family member sequence alignment, and characterization of the evolutionary relationships between members. Unfortunately, all aspects of this generalized process are frustrated by the short and fragmentary nature of metagenomic sequence. To circumvent these limitations, we developed a bioinformatic strategy that first references well-annotated whole genome data to characterize known gene families as probabilistic models and then uses these models to guide the classification, alignment and phylogenetic analysis of metagenomic sequence. This generalized strategy must be tuned to accomodate the evolutionary properties of the various biological molecules under investigation (e.g., DNA, RNA, protein). To date, we have developed workflows that enable the classification of metagenomic sequence as SSU-rRNA and protein families. The endpoint of the workflow is a database, currently under development, cataloging phylogenies of gene families (inclusive of reference and metagenomic data) which will be leveraged to investigate questions pertinent to the characterization of diversity and the discovery of genetic and taxonomic novelty.
Microbial diversity and the discovery of novel organisms

Ecologists and evolutionary biologists traditionally characterize microbial diversity by clustering highly similar SSU-rRNA sequences obtained from an environmental library into operational taxonomic units (OTUs). The sequences in such studies are typically generated via PCR amplification, a process known to be biased by various in vitro variables. We posit that shotgun sequencing of SSU-rRNA from the environment can circumvent these biases and identify novel organisms that have eluded discovery via PCR amplification. If our hypothesis is correct, metagenomic based characterization of OTUs should not only expand our characterization of microbial diversity, but provide more accurate insight into the principles of microbial ecology and evolution.
Unfortunately, because shotgun sequencing provides fragmentary and non-overlapping reads, the traditional means of clustering sequences into OTUs – pairwise percent similarity – is an inviable option. Thus, we (Sharpton, Kembel, Ladau, O'Dwyer, Risenfeld, Eisen, Green, and Pollard) developed a bioinformatic workflow that enables the identification of SSU-rRNA from metagenomic libraries and the classification of these sequences into OTUs. Our method leverages high quality SSU-rRNA sequences made available from the Ribosomal Database Project to build probabilistic profiles of SSU-rRNA for Bacteria, Archaea and Eukaryotes. Metagenomic reads homologous to SSU-rRNA are aligned to the appropriate profile and a phylogenetic tree of these reads is then constructed. The phylogenetic distance spanning a pair of reads is subsequently used to cluster sequences into OTUs. The key insights that enabled this project to work are (1) full length sequences from full genomes and PCR-based rRNA studies can be used to guide identification, alignment, and clustering of fragmentary SSU-rRNA sequences from metagenomic libraries, and (2) sequence phylogenies can be used to compute a distance between short, possibly non-overlapping reads.
Initial testing of the workflow on the complete global ocean survey (GOS) resulted in several key observations regarding our generalized phylogenomic classification strategy:
- profile based classification and alignment performs better than other methods considered (progressive and iterative sequence alignment).
- the higher the quality of the reference sequence data used to construct profiles, the better the classification sensitivity
- reads are aligned to profiles independently, ensuring that a noisy sequence does affect not the majority of the alignment signal
- short reads can be locally aligned to profiles in a high-confidence fashion
- at least for SSU-rRNA, the profiles must be assembled independently for each major life domain (structural variation is high across domains)
In short, probabilistic family profile based methods provide a robust means of classifying and aligning short, fragmented metagenomic reads into well-defined families. Using this method on the GOS data revealed >4,000 OTUs across 73 geographical sites. This data is being leveraged by other iSEEM projects to study microbial distance-decay relationships.


If our hypothesis of PCR sequencing bias and the discovery of microbial diversity is correct, we expect, all else being equal, that metagenomic sequencing will reveal the OTUs found by PCR sequencing plus additional OTUs undiscoverable by PCR. Running our workflow on the GOS metagenomic and PCR sequence libraries as well as the human distal gut metagenomic and PCR libraries produces evidence in support of this hypothesis. In the GOS data, we observe that both PCR and metagenomic (WGS) libraries have sampled OTUs to saturation, suggesting that additional sampling by either method will not increase the detected amount of diversity . That said, as revealed in the Venn Diagram below, the WGS libraries reveal substantially more OTUs than the PCR libraries and identify 94% of the OTUs found by PCR. This observation suggests that metagenomics can reveal a cross section of the biosphere unobservable by traditional PCR sequencing.
In addition, despite relatively poor sampling in the distal gut WGS library, we find that metagenomics can reveal novel OTUs compared to its correspoding PCR library (sequenced to saturation) and to curated SSU-rRNA sequence databases (e.g. GreenGenes and RDP). In fact, one such OTU contains sequence diverged enough from any other known SSU-rRNA that it likely represents a new Bacterial Family.
Our current efforts are focused on applying simulated data to our workflow to evaluate the sensitivity and specificity of our methodology. We expect manuscript preparation will begin in the near future. Our software has been packaged and will be released through an open source license with any manuscript that results from this work.
Functional diversity and novelty


Taxonomic diversity, as reveal by analysis of SSU-rRNA sequences, is only one aspect of biodiversity. Our characterization of protein family diversity, or functional diversity, is relatively poor given that few families can be easily amplified by PCR and few organisms can be cultured for whole genome sequencing. Indeed, to directly survey functional diversity from the environment requires the use of metagenomic sequencing, which in turn requires a means of classifying short, fragmentary metagenomic sequences into their proper families. We (Sharpton, Eisen, Pollard) used a similar phylogenomic strategy to develop a workflow that classifies metagenomic reads into protein families. Here, protein families are constructed by clustering high quality genome sequence data (see collaboration of Wu, Jospin, Langille, Sharpton, Pollard and Eisen, above) into homologous groups. A probabilistic profile encoding the evolutionary diversity of each family is then constructed. Annotated metagenomic reads are classified and aligned to families exhibiting homology. Phylogenies are inferred from these alignments and subsequently leveraged to detect novel subfamilies and identify those families and communities where additional sampling is likely to reveal biological novelty.
We evaluated the performance of our method by searching for photosynthesis-related metagenomic protein sequences along a marine depth column (HOT/ALOHA). Specifically, we screened for sequences homologous to the Photosynthesis Reaction Complex (PhotoRC) families. We expect to find no PhotoRC-related proteins beyond the limit of the photic zone, which is approximately 200 m below the surface of the ocean. As illustrated in this IMAGE, we observe our expectation, finding PhotoRC-related metagenomic sequences only in samples corresponding to photic zone depths. While this is certainly not an exhaustive test of our method, it provides cause for additional investigation and development.
We are currently developing a relational database that links up with this workflow and evaluating the method's rigor by using simulation data. Once we have finished clustering whole genome data into high quality families (above), we will apply our workflow to various metagenomic samples across all protein families and make the results publicly available through the database. In addition, the results cataloged in this database will be used to discover novel subfamilies revealed by metagenomic sequences.
2.1b. Focused assessment of global evolutionary patterns and trends.
- Status 50% complete
Several global data sets have been processed using the OTU pipeline (see above). This process generates phylogenetic trees for molecular evolutionary analyses. Analyses of evolutionary patterns and trends are underway, including correlation analyses with environmental metadata.
2.1c. Detailed investigation of particular cases of very rapid genome evolution.
- Status 20% complete
We are investigating methods for identifying fast-evolving genes using both tree topology and branch lengths. These methods will be applied to the large database of protein families that we are developing. This analysis will highlight outlier (i.e. very rapidly diverging) gene families for focused investigations.
2.1d. Integrate methods into CAMERA tools.
- Status 5% complete
We have contacted CAMERA about integrating our OTU discovery workflow into their online suite of tools.
2.2 Population genomics (Eisen & Wu).
2.2a. Develop an ecologically oriented genomic species concept for microbes.
- Status: 50% complete


The uncultivability of such a large proportion of known prokaryotic life means that the vast majority of bacterial diversity consists of organisms known only by DNA sequences. This presents a unique challenge inherent to the study of microbial diversity that macrobial ecologists rarely face. One approach to overcome this hurdle is to construct and test theoretical models that describe what attributes bacterial species should have, and then to use computer algorithms to identify bacterial species based on the criteria in those models. Ecotype Simulation is an algorithm which generates predictions of the number of ecotypes within a community, and the ecotype identity of each sequence, based on DNA sequences data alone, without the need for cultivation of the organism. Ecotype Simulatation therefore provides us with a powerful tool to study the diversity of otherwise uncultivable bacteria, and makes it ideal for studying diversity using metagenomic data.
In using Ecotype Simulation to characterize the diversity of microbial populations, we present an alternative to commonly used OTUs as proxies for bacterial species. Ecotypes are likely to provide a better estimate of true community diversity than are OTUs delineated by universal threshold levels of 16s rRNA sequence diversity. This is because ecotypes predicted by Ecotype Simulation are hypothesized to have species-like properties such as a cohesive force limiting divergence within a population (periodic selection), a shared evolutionary history and historic fate and prognosis for future coexistence (ecological distinctness). These are evolutionary and ecological properties that universal 16s threshold-based OTUs do not necessarily share.
The specific direction our work so far has been to apply the Ecotype Simulation algorithm to the GOS metagenome data in an effort to estimate both the level of ecotype diversity among marine bacteria, and the rate of ecotype evolution (specifically ecotype formation and periodic selection rates). Our efforts thus far have been directed at applying the algorithm to protein coding genes of the taxon, Candidatus Pelagibacter ubique, also known as SAR11. Because this taxon is so abundant among marine samples, and because it seems to be present in many diverse habitats, it seemed a likely candidate for containing significant levels of cryptic ecotype diversity, potentially detectable using Ecotype Simulation.
Some 3107 peptide sequences of the protein coding gene rpoB identified as putatively belonging to the Pelagibacter clade were obtained from the GOS data at CAMERA, and aligned the peptides using AMPHORA, along with all of the rpoB sequences present for all species in ComboDB. A phylogenetic tree was generated from this alignment, which allowed us to confirm that these sequences were closest relatives of the Pelagibacter marker sequence, and thus belonged to the Pelagibacter clade. Since the current version of Ecotype Simulation is not capable of performing an analysis on so many sequences, we selected a monophyletic subclade, consisting of 758 sequences on which to perform our pilot analysis. A dna alignment of these sequences was generated from the peptide alignment. From the alignment of those 758 sequences we selected a 600bp region of the rpoB gene that had good coverage among the sequences reads selected, and largely overlapped with the region of the rpoB gene used in past Ecotype Simulation analyses of Bacillus subtilis. We then eliminated from the data any sequence that did not fully overlap with that region, which left 176 sequences, which, while workable, is near the Ecotype Simulation program’s upper limit of 200 sequences. Extending the region to 725bp further reduced the dataset to fifty sequences, a number easily manageable by Ecotype Simulation. We used Ecotype Simulation to analyze both of these datasets, as well as 137 sequences of a 472bp region of the dnaG gene, obtained using the same methods.
Clade Sequence Diversity curves were generated for each of these data sets (see attached images A-D), using the binning program contained within ecotype simulation. This program bins the sequences based on different similarity criteria using complete linkage clustering. The Clade Sequence Diversity curve is a representation of the history of ecotype evolution withinin the clade, and is generated based on the binning results. This binning data is the basic input to the ecotype simulation program, and serves as the observed result to which the program can compare results generated by the simulation.
Examining the clade sequence diversity curves generated from the binning results on our Pelagibacter sequences, we have noted that a key difference seems to be that they lack the characteristic flare-up of diversity at the 95% and greater binning criteria that had been observed in prior analyses (Compare the curve in image D to those in A-C). Since the model generally uses the slope of this flaring region to estimate the rate of periodic selection (the flare is theorized to indicate an ephemeral build-up of diversity within extant ecotypes, which is will be purged during the selective sweeps) we feel this warrants further investigation. One possibility is that the Pelagibacter clade undergoes more frequent periodic selection than prior taxa analyzed using ecotype simulation, but before we can conclude this, we need to eliminate several alternative explanations, including artifacts based on sampling. A relatively shallow sampling, with few representatives from each sampled location, could skew the results to make it appear that there was less within-ecotype diversity present than was the case in actual fact. We are currently pursuing two approaches to addressing this possibility.
1) We are examining the phylogeny of our existing sample to see if we can find areas with greater microdiversity, which might generate a curve more typical of those observed in the past.
2) We are looking for data sets with deeper sampling at particular locations, which might give us a more accurate reflection of the microdiversity within the clade. One possibility is the Sargasso Sea dataset.
By using Ecotype Simulation to predict number of ecotypes, and the constituencies of putative ecotypes, we hope to then compare our results to OTU estimates for the same clade. This will allow us to determine how well OTUs based on a particular diversity threshold compare to ecotype predictions. Additionally, by correlating putative ecotypes to different habitat associations based on the GOS metadata, we hope to formulate hypothesis regarding the the basis of the ecological distinctness between ecotypes delineated by Ecotype Simulation.
2.2b. Develop phylogenetic co-binning approach for determining if multiple populations are present in a sample.
This research area has been the focus on many groups outside our project and in some ways it has been solved by others. However, in Year 3 of the project, Aaron Darling in the Eisen lab will be working on an extension of the co-binning approach not yet done by other groups.
2.2c. Correlation analysis on general patterns of “evolvability” such as mutation rates, population size, and recombination patterns with community characteristics.
- Status: 33% complete
We have shifted slightly the focus on this research area to be on functional classification and characterization of metagenomic data, in particular an examination of genes of unknown function,. The goal of this is to try and increase the ability to predict both functions in organisms in the environment and to use ecological studies to discover new functions. Our work in this area is summarized int he sections below (being led by Morgan Langille in the Eisen lab).
Identification and Characterization of Genes of Unknown Function

A large fraction of sequenced genes have no known functional annotation associated with them. The proportion of genes with no known function in metagenomic sequencing projects is even larger since they often sample diverse species that have no relatives with similar genes. Considering that the vast majority of gene annotation is performed using computational similarity approaches to transfer annotations from previously sequenced genes, this proportion of unknown genes is unlikely to improve in the future. These genes are often ignored since most analyses will not provide much biological insight for the species or environment sample being sequenced. However, these genes most likely contain novel functions that would be of scientific and industrial interest. In addition, determining and characterizing these genes would improve comparative analyses between species and environments. This objective has two main objectives: 1)characterizing and ranking of protein families with no known function across all species and metagenomic samples and 2) developing and combining methods for determining the function of these protein families.
Constructing protein families of unknown function
The quality of a gene annotation is diverse depending on who or when a particular species was annotated. Further, most metagenomics samples do not contain any annotation for the genes contained within them. Therefore, to identify genes with unknown function we started with all 7.3 million proteins from 1901 completed genomes in the JGI IMG dataset, and searched for those proteins that have no hits to PFAM domains or contain hits only to PFAM Domains of Unknown Function (DUFs). This analysis identified 2.1 million proteins (30%) that had no known function. The proportion of unknown genes per genome varied from 11% (Haemophilus influenzae) to 74% (Plasmodium chabaudi). Families were constructed using these proteins which resulted in 1479 families with at least 100 proteins in each. These families and the unknown genes within them were loaded into a MySQL database for further analysis.
Describing protein families of unknown function
The number of proteins in each of the 1479 protein families with unknown function, contained between 100 and 2040 proteins. To examine the phylogenetic diversity of these families, the universality (percentage of genomes with at least one family member) for Archaea, Bacteria, and Eukaryota was calculated. Many families had high universality (>70%), while surprisingly 4 families had universality values greater than 10% in all 3 domains of life (see table below). Another 19 families had members that were present (>10%) in either Bacteria or Archaea and also in Eukaryota. Further characterization of these families is planned, such as identifying those present primarily in pathogens or particular environments. HMMs will be constructed for these families so that metegenomics samples can be scanned using a HMMer search; thus providing more information about their prevalence in particular environments. In turn, this data may help distinguish possible functions for some of these protein families (see Community Profiling below).
| Fam id | Number of Proteins | Archaea Universality | Bacteria Universality | Eukaryota Universality |
|---|---|---|---|---|
| 3 | 1594 | 16 | 67 | 76 |
| 31 | 713 | 14 | 33 | 14 |
| 250 | 281 | 38 | 12 | 43 |
| 296 | 256 | 22 | 12 | 32 |
Community profiling


Community profiling is a novel non-similarity based approach being developed and tested for the annotation of genes with unknown function. It leverages the massive amount of sequence data from multiple samples in metagenomics data to identify families of genes that have similar profiles (absence/presence or relative numbers of genes) across various environmental samples. The hypothesis is that these families with similar profiles may have similar functions. It is currently not clear how well this methodology will work in practice, but if successful it could help identify possible functions for completely novel gene families.
A first attempt at community profiling was done by identifying PFAMs (11,000 HMMs) in metagenomic sequences from the GOS dataset (41 million peptide sequences across 80 samples). Pfam predictions (12.5M) by HMMER 3 were grouped into their corresponding samples and enumerated. This data was then clustered using the microarry clustering software, Cluster 3.0.
PFAMs that have similar profiles (clustered together), may have similar function. For example in the figure at right, a cluster of PFAMs all seem to be related to phage and using this data, domains of unknown Function (DUFs), DUF3110 and DUF2973 could be hypothesized to also be related to phage.
We are currently fine tuning (normalizing the data in various ways), and evaluating how well it works. Future research will expand the number of metagenomic samples beyond the GOS data, thereby giving more resolution to genes with similar profiles. The profiles of the unknown gene families (see above) will then be compared to the profiles of gene families with known function. The community profiling method will be combined with other non-similarity based functional annotation methods to build supportive evidence in determining the function of the these unknown gene families.
Outcome 1, Output 3: Develop statistical methods to correlate metagenomic sequence data with environmental metadata.
3.1 Development of statistical tools for metagenomic data (Pollard).
3.1a. Survey metagenomic data to determine scope of data types.
- Status 100% complete
A preliminary step of the iSEEM project was to use CAMERA to assemble information about existing metagenomic data. We compiled information on the types of metadata that are available for each project on CAMERA by consulting (i) individual metadata files for each project (on each project's webpage) and (ii) the listing of metadata on the CAMERA Project Samples webpage. We also gathered information on sequence data for each project by consulting files available for download on each project's webpage, published papers for each project, and the File Server Download page. For additional details, please refer to the 2008 Annual Report.
We continue to monitor CAMERA for new data sets and to explore other sources of data.
3.1b. Develop a metagenomic simulation pipeline; Use simulated data to evaluate methods in other sections, such as 1.1 (trees), 1.3 (diversity estimators), and 2.1 (evolutionary rates).
- Status 60% complete
Phylogenetic trees enable powerful analyses of taxonomy, community diversity, and evolutionary patterns. It is not obvious, however, how to quantify evolutionary distance between fragmentary, non-overlapping metagenomic sequence reads. Our aim is to establish whether metagenomic phylogenies can be reliably constructed for individual gene families.
Most molecular phylogenetic methods depend upon a multiple sequence alignment. We exploit complete gene sequences from fully sequenced microbial reference genomes to compute probabilistic profiles for gene families. To build alignments from metagenomic data, we match and align reads and reference sequences to the family profiles. From the alignments, we infer phylogenies that enable us to assess phylogenetic relationships between reads that may not overlap in the alignment.
To validate our profile alignment approach and compare performance of tree-building algorithms, we (Sam Riesenfeld in collaboration with Tom Sharpton, Steve Kembel, Jessica Green, and Katie Pollard) developed a well-parameterized simulation pipeline that considers, in particular, the size and complexity of the simulated community and reference database. As a command-line tool, it can be run in batch to generate large sets of simulated metagenomic data. It leverages existing databases, including AMPHORA protein marker genes and 16S rRNA, as well as existing software including MetaSim and HMMER.
We are currently developing good measures of performance (that take into account, for example, branch lengths as well as topology), and of analyzing the results. One means of evaluation is to compare phylogenies inferred in the simulated metagenomic context to those inferred from corresponding full-length gene sequences. Initial results indicate that many measures of performance are strongly influenced by the size and breadth of the reference database. The initial results also indicated the need for more simulated data with different parameter settings. Hence, we are generating more data and running it through the tree inference and analysis pipeline.
Since several important methods developed by the iSEEM project rely on phylogenies, including the identification of OTUs and the measurement of diversity within and between metagenomic samples, we are also in the process of evaluating the robustness of these downstream analyses.
We expect more complete results within a month and a draft for submission for publication within a couple of months. The simulation pipeline and our results are will be presented in a talk or poster at the Cold Spring Harbor Laboratory Meeting on the Biology of Genomes in May 2010.
3.1c. Develop and evaluate methods for correlation analysis of metagenomic data.
- Status 75% complete
The methods described in section 1.4b are not only useful for mapping the distribution of microbes in geographic space, but also in niche space. For instance, a particular taxon might only tolerate certain combinations of salinity and temperature -- high salinity and low temperature, and moderate salinity and moderate temperature. These combinations can be visualized by creating a graph, in which the vertical-axis is salinity, the horizontal-axis is temperature. The shape of the region that a taxon inhabits in such a niche space has strong implications for understanding that taxon's evolution and functional properties. To infer these shapes, our strategy is to perform the distance-decay analyses described in section 1.4b in such spaces, where samples are thought of as being taken not at locations in geographic space (i.e., latitude/longitude), but rather at locations in the niche space (e.g., salinity/temperature locations).
In addition to the range estimation methods, null model tests may provide a important component of correlation analysis. As part of ongoing work, we have been considering null model tests of presence–absence data ("NMTPAs") (Ladau et al, 2010). These tests provide important tools for inferring effects of competition, facilitation, habitat filtering, and other processes from observational data in ecology. Many NMTPAs have been developed, but they often yield conflicting conclusions when applied to the same data. Type I and II error rates, size, power, robustness and bias provide important criteria for assessing which tests are valid, but these criteria need to be evaluated contingent on the sample size, null hypothesis of interest, and assumptions that are appropriate for the data set that is being analyzed. We have developed user-friendly software, MPower, for evaluating NMTPAs contingent on these factors. Evaluating the validity of NMTPAs based on these factors is important towards ensuring that reliable inferences are drawn from observational data about the processes controlling community assembly.
3.1d. Apply correlation analysis to publicly available data.
- Status 25% complete
We have begun inferring the shapes of the niches that oceanic microbes inhabit using the GOS metagenomic data. The GOS data cover a wide range of environmental conditions, making them well-suited for this analysis. In temperature x salinity space, we have found that the taxa occupy a wide range of niche shapes, ranging from highly circular to extremely elongate. While these results are preliminary, they suggest that the microbial taxa found in the GOS samples differ greatly in their functionality and evolution. These analyses are ongoing, and by looking a correlates of range shape and developing evolutionary models that predict niche shapes, we hope to gain insight into the biological processes underlying the niche differentiation.
3.1e. Integrate methods into CAMERA tools.
- Status 0% complete
We will contact CAMERA once these tools are mature.
Additional information about the project that does not fit into above categories
WATERS
Amber Hartman, who was a PHD student in the Eisen lab, worked for a summer project on designing a Kepler Workflow system for analysis of rRNA sequences. The software, known as WATERS (a Workflow for the Alignment, Taxonomy, and Ecology of Ribosomal Sequences) is designed to allow any user to carry out a series of analyses of rRNA data. We did this project in collaboration with one of the teams that designs the Kepler workflow system, in part in the hope that this would help us work with the Kepler team that is part of the CAMERA project. The abstract of the paper describing WATERS is below:
For more than two decades microbiologists have used a highly conserved microbial gene as a phylogenetic marker for bacteria and archaea. The small-subunit ribosomal RNA gene, also known as 16S rRNA, is encoded by ribosomal DNA, 16S rDNA, and has provided a powerful comparative tool to microbial ecologists. Over time, the microbial ecology field has matured from small, proof-of-principle experiments in novel environments to massive collections of sequence data that are paired with dozens of corresponding collection variables. As the complexity of data and tool sets have grown, the need for flexible automation and maintenance of the core processes of 16S rDNA sequence analysis has increased correspondingly.We present WATERS, a new integrated approach for 16S rDNA analysis that bundles essential, state-of-the-art 16S rDNA analysis software tools into a single, comprehensive software package that can be used by a broad range of users without requiring specialized bioinformatics or programming expertise. WATERS employs a flexible, collection-oriented workflow approach using the open-source, community-driven Kepler system as a platform. WATERS simplifies 16S rDNA analyses, increases the efficiency of workflow execution, and facilitates result interpretation and reproducibility via a data provenance sub-system. Applying an automated workflow approach to 16S analysis allows microbial ecologists to minimize the time normally dedicated to carrying out dozens of tedious manual steps typical for many bioinformatics applications (e.g., data format conversions and file management, or installation and maintenance of multiple, complex software systems), and to focus their attention instead on the biological interpretation of the results automatically generated by WATERS. We have designed WATERS to be both modular and easily evolvable in hopes that the larger microbial ecology field will continue to further develop and add to the component library. We see WATERS as the initial seed for a sizeable and growing repository of interoperable, easy-to-combine tools for asking increasingly complex microbial ecology questions.
Bioinformatics Engineer

In order to facilitate communication between the different groups of researchers but also to prevent duplicate or similar jobs to be repeated, a couple communication tools were set up. An online forum and a google group (iseemproject) are currently active. The google group seems to be the preferred medium so far. users to open tickets to request tasks to be completed. It is a centralized place to ask for anything related to the bioinformatics engineer(s) duties. The iSEEM Wiki page was updated with all the information for such resources.
- Work in progress:
- The migration of information from the private Wiki page to the public part of the website is in progress, the information to be migrated includes the software packages and papers that were supported by the grant. Papers that were part of the previous reports will also be included in the public webpage.
- Gathering and formatting data is being done upon requests from the researchers such as downloading the Integrated Microbial Genomes data from the Joint Genome Institute, store the flat files on our server, and generate a relational database. This data was used for the protein families project that includes building multiple alignments, HMMs, running scans on the database and generating statistics from the results. Once the protein families were generated from 100 genomes, 720 (of 17232) families were selected with a universality greater than 50 and scanned against the IMG database. The scan was run against 6,413,018 sequences, of those, 3,833,317 were hits on the families' HMMs. After requiring an 80% coverage on both the sequence and the HMMs, 1,530,439 remained in the results. It was found that 109,566 sequences were assigned to more than 1 family. From this point on, we need to explore whether or not a sequence is truly part of the more than one family or if the families are related enough that hmmer matches that sequence to two families. Another option would be to set up more stringent parameters for the scan hits.
BioTorrents
The transfer of scientific data has emerged as a significant challenge, as datasets continue to grow in size and demands for open access sharing increases. Current methods for file transfer do not scale well for large files and can cause long transfer times.
We created BioTorrents (http://www.biotorrents.net), a website that allows open access sharing of scientific data and uses the popular BitTorrent peer-to-peer file sharing technology. BioTorrents allows files to be transferred rapidly due to the sharing of bandwidth across multiple institutions and provides more reliable file transfers due to the built-in error checking of the file sharing technology. BioTorrents contains multiple features, including keyword searching, category browsing, RSS feeds, torrent comments, and a discussion forum.
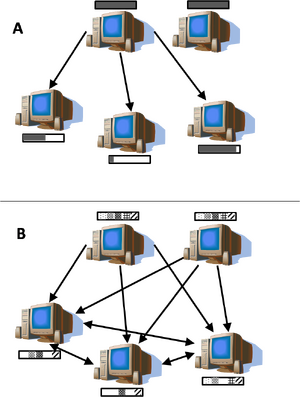
The amount of data being produced in the sciences continues to expand at a tremendous rate. This is especially true for metagenomic datasets such as the GOS protein dataset (~46GB),that can often take hours or days to download. In parallel, and also at an increasing rate, is the demand to make this data openly available to other researchers, both pre-publication and post-publication. Considerable effort and attention has been given to improving the portability of data by developing data format standards, minimal information for experiment reporting, data sharing polices, and data management. However, the practical aspect of moving data from one location to another has relatively stayed the same; that being the use of Hypertext Transfer Protocol (HTTP) or File Transfer Protocol (FTP). These protocols require that a single server be the source of the data and that all requests for data be handled from that single location (Fig. 1A). In addition, the server of the data has to have a large amount of bandwidth to provide adequate download speeds for all data requests. Unfortunately, as the number of requests for data increases and the provider’s bandwidth becomes saturated, the access time for each data request can increase rapidly. Even if bandwidth limitations are very large, these file transfer methods require that the data is centrally stored, making the data inaccessible if the server malfunctions.
An alternative method for data transfer that alleviates these shortcomings is to use a peer-to-peer file sharing technology, such as BitTorrent. The BitTorrent protocol works by first splitting the data into small pieces (usually 514Kb to 1Mb in size), allowing the large dataset to be distributed in pieces and downloaded from various sources (Fig. 1B). A checksum is created for each file piece to verify the integrity of the data being received and these are stored within a small “torrent” file. The torrent file also contains the address of one or more “trackers”. The tracker is responsible for maintaining a list of clients that are currently sharing the torrent, so that clients can make direct connections with other clients to obtain the data. A BitTorrent software client uses the data in the torrent file to contact the tracker and allow transferring of the data between computers containing either full or partial copies of the dataset. Therefore, bandwidth is shared and distributed among all computers in the transaction instead of a single source providing all of the required bandwidth. The sum of available bandwidth grows as the number of file transfers increases, and thus scales indefinitely. The end result is faster transfer times, less bandwidth requirements from a single source, and decentralization of the data.
Torrent files have been hosted on numerous websites and in theory scientific data can be currently transferred using any one of these BitTorrent trackers. However, many of these websites contain materials that violate copyright laws and are prone to being shut down due to copyright infringement. In addition, the vast majority of data on these trackers is non-science related and makes searching or browsing for legitimate scientific data nearly impossible. Therefore, to improve upon the open sharing of scientific data we created BioTorrents, a legal BitTorrent tracker that hosts scientific data and software.
BioTorrents allows files to be transferred rapidly due to the sharing of bandwidth across multiple institutions and provides more reliable file transfers due to the built-in error checking of the file sharing technology. BioTorrents contains multiple features, including keyword searching, category browsing, RSS feeds, torrent comments, and a discussion forum.
A manuscript entitled, "BioTorrents: A File Sharing Service for Scientific Data" by Morgan G.I. Langille and Jonathan A. Eisen was submitted to PLOS ONE and upon the request of the reviewer's comments is currently being revised. We predict the manuscript to be accepted within the next month.
Please describe progress towards achieving Outcome 1, including mentioning the Outcome 1 milestones you expect to accomplish in the coming year. Lastly, how is progress towards achieving this Outcome culminating in a greater understanding of marine microbiology and/or marine microbial ecology?
All of the sections above provide a detailed explanation of our progress towards achieving Outcome 1. In the coming year we anticipate coming closer to our goal of 100% completion in each area. Progress toward achieving Outcome 1 has advanced our understanding of marine microbial ecology in several ways. First, we have developed novel bioinformatic tools to characterize the structure and diversity of complex marine microbial communities sampled using metagenomic techniques. These tools have allowed us to better understand marine microbial biodiversity using a multi-gene approach that is based on both taxonomy and phylogeny. Second, we have created a powerful simulation framework that can be used across a variety of studies to verify existing and emerging metagenomic diversity estimation techniques. Third, we have generated novel theory to predict biogeographic patterns in marine systems, including microbial range maps and species-area relationships.
2. Publication and Patents
Publication list
| Publication details | Was invited | Review | Team member as 1st author? | Press release/news | Model? | Tool? |
|---|---|---|---|---|---|---|
|
|
|
|
|
|
|
|
| K.S. Pollard, M.J. Hubisz, K.R. Rosenbloom, A. Siepel (2009). Detection of non-neutral substitution rates on mammalian phylogenies. Genome Research, 20: 110-121. This methods paper produced an approach and computer code that will be useful for quantifying rates of evolution in metagenomic trees as well as mammalian phylogenies. | Yes | |||||
| J. Ladau, S.J. Ryan (2010). MPowering ecologists: community assembly tools for community assembly rules. Oikos, in press. Currently available online at www3.interscience.wiley.com/journal/123242628/abstract | Yes | |||||
| T. Sharpton, S. Kembel, J. Ladau, J. O'Dwyer, S. Riesenfeld, J. Eisen, J. Green, K. Pollard. Characterizing microbial diversity from environmental shotgun sequencing data. (In preparation). | Yes | |||||
| J.P. O'Dwyer J. K. Lake, A. Ostling, V. M. Savage, J. L. Green (2009). An integrative framework for stochastic, size-structured community assembly. Proc Natl Acad Sci 106:6170-6175. | Yes | Yes | Yes | |||
| J. P. O'Dwyer, J.L. Green (2009). Field theory for biogeography: a spatially explicit model for predicting patterns of biodiversity. Ecol Lett 13:87 - 95. | Yes | Yes | Yes | |||
| S.W. Kembel, J.A. Eisen, K.S. Pollard, and J.L. Green. Metagenomics reveals the phylogenetic diversity and turnover of marine microbial communities. (In review at PLoS Biology). | Yes | |||||
| S.W. Kembel, P.D. Cowan, M.R. Helmus, W.K. Cornwell, H. Morlon, D.D. Ackerly, S.P. Blomberg, and C.O. Webb. Picante: R tools for integrating phylogenies and ecology. (In review at Bioinformatics). | Yes | |||||
| Wu D, Hugenholtz P, Mavromatis K, Pukall R, Dalin E, Ivanova NN, Kunin V, Goodwin L, Wu M, Tindall BJ, Hooper SD, Pati A, Lykidis A, Spring S, Anderson IJ, D'haeseleer P, Zemla A, Singer M, Lapidus A, Nolan M, Copeland A, Han C, Chen F, Cheng JF, Lucas S, Kerfeld C, Lang E, Gronow S, Chain P, Bruce D, Rubin EM, Kyrpides NC, Klenk HP, Eisen JA. A phylogeny-driven genomic encyclopedia of Bacteria and Archaea. Nature. 2009 Dec 24;462(7276):1056-60. | Yes | Significant press coverage including New York Times article | ||||
| T. Woyke, G. Xie, A. Copeland, J.M. González, C. Han, H. Kiss, J.H. Saw, P. Senin, C. Yang, S. Chatterji, J-F. Cheng, J. A. Eisen, M. E. Sieracki and R. Stepanauskas. Assembling the marine metagenome, one cell at a time. PLoS One. 2009;4(4):e5299. Epub 2009 Apr 23. | ||||||
| M.G.I. Langille, J.A. Eisen. BioTorrents: A File Sharing Service for Scientific Data. PLoS One. (in review) File:Biotorrents submission.pdf | Yes | Yes | ||||
| Hartman AL, Riddle S, McPhillips T, Ludascher B, Eisen JA Introducing WATERS: a Workflow for the Alignment, Taxonomy, and Ecology of Ribosomal Sequences BMC Boinformatics (in review) Preprint | Yes | Yes | ||||
| Martin Wu*, Sourav Chatterji* and Jonathan A. Eisen Accounting for Alignment Uncertainty in Phylogenomics In preparation. File:Zorro.pdf | Yes | Yes |
3. Presentations
Template for list
Please list all presentation titles and abstract citations or titles (if appropriate) that have resulted from this project since your last grant report, including those presented at scientific conferences, university seminars, etc. You may send complete abstracts as a separate file (optional). Please bold or highlight terms in the right-hand column to indicate an affirmative.
List
- The iSEEM Project: Phylogenetic approaches to microbial metagenomics. Thomas J. Sharpton, Samantha Riesenfeld, Joshua Ladau, Steven W. Kembel, Jessica L. Green, Jonathan A. Eisen, Katherine S. Pollard. Talk to be presented by Katie Pollard at Cold Spring Harbor Biology of Genomes Meeting, May 2010.
- Building phylogenies with metagenomic sequence reads. Samantha J. Riesenfeld, Thomas J. Sharpton, Steven W. Kembel, Jessica L. Green, Katherine S. Pollard. Talk or poster to be presented by Sam Riesenfeld at Cold Spring Harbor Biology of Genomes Meeting, May 2010.
- Species ranges can be inferred from distance-decay relationships. Joshua Ladau, Jessica L. Green, Katherine S. Pollard. Abstract submitted to Ecological Society of America 2010 annual meeting.
- Field Theory and Community Assembly. James O'Dwyer. Talk presented at the Moorcroft lab meeting, Department of Organismal and Evolutionary Biology, University of Harvard, September 2009. Also presented at the Plotkin lab meeting, University of Pennsylvania, September 2009.
- Community Assembly across the Tree of Life. James O'Dwyer. Talk presented at the Population Biology Seminar, University of Leeds, UK, January 2010.
- From Field Theory to Ecology. James O'Dwyer. Talk presented at the Biomathematics Seminar, University of Durham, UK, January 2010.
- Ecology without species: phylogenetic perspectives on microbial diversity. S.W. Kembel and J.L. Green. Invited speaker, Organized Oral Session on ‘Species interactions and community ecology in the context of relatedness’, Ecological Society of America Annual Meeting, August 2009.
- Measuring phylogenetic diversity. S.W. Kembel. Invited workshop instructor, ‘Ecological approaches to analyzing complex community datasets’ workshop for Fungal Environmental Sampling and Informatics Network members, Botanical/Mycological Societies of America Annual Meeting, July 2009.
- Ecology without species: phylogenetic perspectives on microbial diversity. S.W. Kembel. Invited speaker, Early Career Scientists Symposium on ‘Phylogenies and Ecology’, University of Michigan, March 2009.
- Metagenomics approaches to biodiversity and biogeography. Jessica Green. Talk presented at the University of Ioannina, March 2009.
- Theory and Metagenomics-based Biogeography. Jessica Green. ASM 109th General Meeting in Philadelphia, at the special interest session Genomics Enabled Biogeography of Planet Earth organized by Tiedje and Klugman. May 2009.
- The Rainforest Within: Biodiversity of the Human Body and its Relationship to Health and Disease. Jessica Green was the moderator of this symposium at the Ecological Society of America, which was covered by Nature News (http://www.nature.com/news/2009/090807/full/news.2009.808.html) and their blog (http://blogs.nature.com/news/blog/2009/08/esa_2009_sweater_by_grandma_gu.html).
- Exploring the Invisible. Jessica Green. TED2010, Long Beach, February 2010.
- Microbial genomes. Jonathan Eisen. California Academy of Sciences. October 2009.
- A phylogeny driven genomic encyclopedia of bacteria and archaea. Jonathan Eisen. National Academy of Sciences "Microbes and Health" meeting, Irvine, CA.
- A phylogeny driven genomic encyclopedia of bacteria and archaea. Jonathan Eisen. Keynote Talk, Computational Systems and Bioinformatics Meeting, Stanford, CA.
4. Additional information
A. Exclusive of grant requirements, please describe new research collaborations with other MMI-funded grant project leads, with other marine microbiologists, and with researchers from outside the fields of marine microbiology and marine microbial ecology that resulted from this research (if applicable).
The Pollard lab is collaborating with the laboratories of Adam Siepel (Cornell University; methods for rates/patterns of evolution) and Joe DeRisi (UCSF; metagenomic assembly for viruses).
The Green lab is collaborating with the laboratory of Brendan Bohannan (University of Oregon; exploring biodiversity and biogeography in the human microbiome and the built environment microbiome).
B. Exclusive of grant requirements, have you provided data, samples, cultures, MMI-funded facilities, equipment use, etc. to other researchers? If so, please describe.
No
C. Did you build or improve any instruments, devices, robots or software? Have the codes, designs or specs (etc.) been made available to the public? How many times has this information been downloaded or shared (if known)? Please include information here even if you listed above the related publication that describes this activity.
We have constructed several high-performance software workflows that will be made available under an open access license as soon as we have verified their rigor and accuracy. In the process of building these workflows, stand alone software packages were constructed and released to public repositories. For example, Sharpton extended the BioPerl library by developing a file parser for Sean Eddy's HMMSEARCH software (HMMSCAN parser currently under development). This code has been contributed to the OpenBio foundation. In addition, Sharpton is extending Sjolander's open source SCI-PHY software to accommodate user defined phylogenies. This code will be contributed to the Sjolander group as well as the public domain under an open access license.
Several of our projects nearing completion will result in extensive databases that encode data vital to the biological cyberinfrastructure. These include our database of gene families built from all sequenced microbial genome projects, a database of OTUs identified in various metagenomic sequencing projects, and a database of metagenomic sequences classified into protein families.
The phyloP/PHAST program is freely available (http://compgen.bscb.cornell.edu/phast/) and has been downloaded by hundreds of users this year.
Novel methods for the measurement of phylogenetic diversity developed for this project have been implemented in the software packages Phylocom (http://phylodiversity.net/phylocom) and Picante (http://picante.r-forge.r-project.org). Both are publicly available as open source software packages. Phylocom has been downloaded by >1200 users and cited in >100 published papers; download information is not available for Picante but it has been cited in >20 published papers in the last year. A manuscript describing Picante is currently in review.
D. Please describe any challenges that have been overcome and those that persist in preventing you from achieving any Grant Activities, Outputs and Outcomes.
- There are continuing challenges with working with CAMERA. We have made little progress in making our tools available to the community through the CAMERA web system, though we note that all of the software associated with publications has been released under "open" licenses for anyone to use.
- There was a significant challenge scientifically in determining how to make robust phylogenetic trees that included metagenomic data. The main challenge came from the goal of including as much metagenomic data as possible for each gene family in question. Previously (e.g. in the Venter et al. Sargasso paper) we had only include long metagenomic sequence reads that overlapped with a large fraction of the full length sequences from complete genomes for a family. To include more metagenomic reads meant we had to figure out how to handle cases where one metagenomic read would not overlap at all with some other metagenomic reads. We have spent the better part of a year working on methods needed to handle such cases.
- Our original Bioinformatics Engineer on the project who was supposed to work between the labs in a service type role did not end up being the ideal person for the job. We have hired a new Bioinformatics Engineer who started a few months ago and is now working to catch up on providing certain services to all the labs.
E. Any lessons learned regarding your research and/or collaborations from a scientific, management, or other perspective?
- A great synergy has developed between our labs.
- Weekly conference calls have been very productive and are an essential component of our collaboration. We alternate between all-group and PI-only calls. On both types of calls, we typically cover a few logistical issues and then one or two scientific issues. For the all-group calls one postdoc leads each discussion. This has been a very efficient way for the postdocs to get feedback on their projects and to exchange ideas.
- For several projects (e.g. OTU pipeline, protein family database), we have had additional skype or in-person meetings on a regular basis.
- We found that the volume of sequence generated in metagenomic analyses combined with the specific properties of this type of data posed substantial computation challenges. In addition to procuring the compute resources required to bioinformatically process this data, we had to modify, oftentimes substantially, standard bioinformatic protocols that presume that the sequences being processed are approximately full length and overlap. We also had to solve data management problems given the amount of sequence generated during the metagenomics investigations under study. This has primarily been resolved through the development of several mySQL databases. [Shout out to CAMERA for providing DB and compute resources?]
- We also experienced scientific limitations when trying to engage in comparative analyses. There's very little, if any, built-in systematic consideration for how the data being generated relates to data that currently exists. Consider that genomes have conventionally been sequenced based upon their location in the phylogenetic tree and their phylogenetic proximity to other genome sequenced organisms. Environmental sampling of metagenomic data, however, has yet to adopt a comparative mindset regarding data generation. Researchers understandably concern themselves with generating data that answers a specific question at hand. Unfortunately, because of the different technicalities in data generation (size exclusion filtering, DNA extraction method, sequencing method, non-random geographic sampling, sampling communities at differential depths, etc.), it is very difficult to compare the data generated in a statistically meaningful way. As sequenced based incrimination of marine microbiology grows, so too must our collective awareness of 1) what data currently exists, 2) how that data can be complemented by the analysis and hand and 3) how must we generate data to ensure it is meaningful to other researchers as well. Until such a framework is adopted, we are forced to either develop difficult statistical methods to account for these differences or limit the scope of comparative metagenomic analyses.
F. Please describe any special recognition this project has received, and include information about the ways in which your scientific efforts have made a contribution beyond the field of marine microbial ecology (if any).
- Recognition
- Jessica Green was selected as a TED2010 Fellow.
- In 2009, Katie Pollard was featured in the NOVA television special "What Darwin Never Knew", an Animal Planet show "Mutants", an evolution episode of the German science TV program "Quarks and Co", and a SETI radio program. She also wrote the Scientific American May 2009 cover story about comparative genomics.
- Impacts
- The tools we are developing will empower a wide range of metagenomic studies, from marine environments to the human microbiome. We have re-analyzed several published data sets and found exciting patterns (e.g. novel taxa, associations between phylogenetic diversity and environmental variables) missed in the initial studies.
G. Please list the web addresses for your lab and for any databases, resources, etc. related to this grant.
- http://openwetware.org/wiki/ISEEM
- http://docpollard.com/
- http://biology.uoregon.edu/people/green/
- Eisen lab home page
- STAP download page
- AMPHORA software download page
- ZORRO software page
- WATERs software page
H. Please provide a brief narrative description of expenditures to date and planned upcoming expenses, including an explanation of any budget variances and surpluses.
- In 2009, the Pollard lab spent $5000 on a high-performance multi-core computer server. We also spent several thousand dollars on the annual meeting (paid for all hotel rooms, shared cost of food). We plan to spend approximately $1500 per team member on travel to the June meeting in Oregon and to conferences to talk about our work in the coming year. The remainder of our subcontract is committed to salaries and benefits.
- In 2009, the Green lab spent $15000 on a high-performance multi-core computer server. We will need to spend several thousand dollars on the 2010 annual meeting to be held in Eugene (all hotel rooms, shared cost of food). We plan to spend approximately $1500 per team member on travel to conferences to talk about our work in the coming year. The remainder of our subcontract is committed to salaries and benefits.
I. Please use this space to respond to any additional questions MMI posed when sending you this form (See below). You may also use this space to provide any additional feedback to MMI. How can the Initiative do its job better?
If GBMF were to continue an effort in marine microbiology beyond MMI’s current allocation, where do you think near term (within 5 years) transformative opportunities for marine microbiology and marine microbial ecology will be?
New bioinformatics tools are essential for leveraging the vast amounts of marine microbial data being collected by GBMF researchers. These include pipelines for processing and analyzing sequence data, as well as downstream methods for assessing diversity and linking global patterns to environmental variables. One of the great strengths of MMI data sets is the collection of physio-chemical and geographic data along with genomic data. But, identifying patterns in these large, complex data sets is an ongoing challenge.
Theoretical approaches to understanding spatio-temporal variation in marine communities are sorely needed. Theoretical tools borrowed from physics, ecology and evolution will shed light on the forces driving microbial community assembly in the oceans. Such tools may also be leveraged to make predictions about how marine microbial communities will respond to environmental change. Similarly, understanding the distribution of biological functions in the oceans is important, especially as they pertain to preserving fundamental marine ecosystem processes in the face of environmental change ( e.g. rising global ocean temperatures and ocean acidification).
In your opinion, what are the critical gaps in funding within marine microbial ecology that are unlikely to be filled by current and near terms future national and international funding efforts? Where are the opportunities for foundations, recognizing the much smaller scale of foundation resources?
Very little NIH and NSF metagenomics funding is being directed towards statistical, informatics, and theory tool development. As in many genomics fields, the push is to collect as much data as possible. These data sets offer great opportunity for discovery, but these opportunities could easily be missed without appropriate theory and analysis tools. Foundations such as GBMF can help fill this gap. Bioinformatics tool development is relatively cheap, and offers a great payback per dollar invested.
Another area that GBMF could help develop is the funding of interdisciplinary teams, bringing together novel combinations of skills from across the sciences. An example is the interplay between ecology and genomics. Theoretical tools and empirical experience from ecology help to guide sampling design, allowing us to address ecological questions more effectively, and also make it possible to extrapolate beyond sampled data. These advantages are particularly relevant in addressing issues relating to the enormous diversity of marine microbial life.
The goal of the original initiative was “to transform marine microbiology into an integrated field of marine microbial ecology by applying novel molecular technologies and instruments with the goal of modeling, monitoring, and generating new fundamental knowledge about representative microbial ecosystems in the ocean”. What has the initiative done well? What could it do better?
Overall the initiative seems to have been somewhat successful. Marine microbiology has definitely been transformed for the better. One thing that probably could have been done better would have been in connecting marine microbiology studies to other fields. For example, there is still not enough communication among people who study marine microbial communities with those who study other microbial communities (e.g., human microbiome, soil, etc). There needs to be more cross fertilization between people who study these different ecosystems. In addition, there is definitely not enough interaction between those studying microbial ecosystems and those studying plant and animal communities. Though on the one hand microbial communities are certainly different, there is an enormous amount of knowledge in how to study communities that is found in the plant and animal ecology world. Finally, we believe it would be beneficial to have more integration of those working on theory and methods with those working on collecting and analyzing specific samples (e.g., marine, gut, soil, etc).
What are one or two new goals that build on our previous activities and that will move the field forward?
One way to significantly move the field forward would be to link upfront the research labs that sample the marine environment with research labs that are leaders in ecological and evolutionary theory, statistics, and bioinformatics. This would require collaboration among lab groups with different skills sets, for example labs that collect data and labs that develop theory and bioinformatic tools. To make the bioinformatics tools accessible to the broader scientific community will require funding of software engineers that make polished tools for experimentalists (i.e. to fill the gap that CAMERA is not filling).
We see two interlinked goals in the modeling of microbial community assembly: developing a theoretical understanding of both phylogenetic diversity and functional diversity across spatial and environmental gradients. While taxonomic diversity tells us "who's there", these two ways of looking at biodiversity go beyond this in two distinct, but equally important ways. Phylogenetic diversity tells us not only who's there, but also how they are related, while functional diversity tells us what they are doing. The iSEEM team is using metagenomic data to compute phylogenetic diversity, and has begun modeling biodiversity across environmental gradients, but there is currently no satisfactory theory underlying either of these two approaches. The framework developed by the iSEEM team to predict taxonomic diversity provides the ideal starting point for a more general theory of phylogenetic and functional diversity, and with this theory we will be able to address the following questions:
(1) How will loss of biodiversity due to global change be distributed across the tree of life, and how will this impact the evolutionary potential of marine communities?
(2) How well and how likely is it that marine ecosystems can adapt to loss of functional diversity in microbial communities? Is functionality easily replicated and replaced?
Another important direction is mapping and modeling biodiversity across environmental gradients on a global scale. This relates to our suggestion of making a Field Guide to the Microbes in the marine environment. The iSEEM team has begun modeling diversity in "niche space" (i.e. distance is measured in ecological variables), but the project would need additional support to move forward in this direction.
Where are the opportunities for greater impact—keep funding marine microbial ecology research or expand beyond marine microbes?
Understanding the structure of marine microbial communities is not independent of understanding the structure of microbial communities in the atmosphere and in terrestrial systems. One promising opportunity is to explicitly link air microbial ecology research and marine microbial ecology research, as these two biospheres are tightly coupled. Tools developed by the iSEEM team already expand beyond marine microbes; they are applicable to marine, terrestrial, atmospheric, and host-specific microbial systems.
If GBMF were to reframe the Initiative to go beyond marine microbes, what directions would you recommend?
We suggest reframing the Initiative to develop a Field Guide to the Microbes. E.O. Wilson's Encyclopedia of Life does not explicitly include Bacteria and Archaea. A Field Guide to the Microbes would include mapping diversity in aquatic, terrestrial, air, and biological (host) systems. This endeavor would entail linking genomic data and environmental variables on a global scale, and require the expertise of both field biologists and bioinformaticians.
If GBMF were not to continue funding marine microbial ecology beyond its current allocation, what might be the anticipated consequences?
Collaborative, interdisciplinary projects like ours that have developed good synergy and momentum would likely disintegrate since they do not fall clearly under initiatives from other funding agencies and depend upon the forward-looking, broad vision of GBMF.
5. Nucleic acid sequencing
No sequencing is supported by this grant.
6. Personnel
Personnel Table
| Name | Personnel Category | Total approx. duration of support : <3months, 3-12 months, or >12 months | Degree earned, if any | If no longer a current employee, enter new employer / university and job title or student status | Community service, awards or any other special achievements earned in connection with this grant |
|---|---|---|---|---|---|
|
|
|
|
|
|
|
| Srijak Bhatnagar, Eisen Lab | Bioinformatics Engineer | >12 months | N/A | Not working on iSEEM currently | |
| Dongying Wu, Eisen Lab | Associate Project Scientist | >12 months | N/A | N/A | |
| Amber Hartman, Eisen Lab | PhD student | 3 months | N/A | CA Policy Fellowship | |
| Thomas Sharpton, Pollard Lab | Postdoctoral Researcher | >12 months | N/A | N/A | pending decision: NSF Postdoctoral Research Fellowship |
| Guillaume Jospin, Eisen Lab | Bioinformatics Engineer | 12 months | N/A | N/A | N/A |
| Joshua Ladau, Pollard Lab | Postdoctoral Researcher | >12 months | N/A | N/A | N/A |
| Samantha Riesenfeld, Pollard Lab | Postdoctoral Researcher | >12 months | N/A | N/A | N/A |
| Alex Koeppel, Wu Lab | Postdoctoral Researcher | <3 months | N/A | N/A | N/A |
| Jessica Bryant, Green Lab | Research Technician | 3 months | N/A | Ed DeLong/MIT/Research Technician | |
| Steven Kembel, Green Lab | Postdoctoral Researcher | >12 months | N/A | N/A | N/A |
| James O'Dwyer, Green Lab | Postdoctoral Researcher | >12 months | N/A | N/A | N/A |
| Morgan Langille, Eisen Lab | Postdoctoral Researcher | >12 months | N/A | N/A | N/A |
7. Additional information
Meetings
November 2009
At the end of November, Josh Ladau, Steven Kembel, James O'Dwyer, and Jessica Green met at the University of Oregon for two day to discuss new collaborations between Katie Pollard's and Jessica Green's labs. Two areas of collaboration were identified: the development of new phylogenetic null models, and the development of dynamical models predicting the shapes of ranges, which can be tested using our range estimation methods. Both of these collaborations are now underway.
December 2009
We held an annual meeting in December of 2009 over two days at the Gladstone Institute in San Francisco. Participants were Jessica Green, Steve Kembel, James O'Dwyer, Katie Pollard, Josh Ladau, Samantha Riesenfeld, Jonathan Eisen, Martin Wu, Dongying Wu, Aaron Darling, Srijak Bhatnagar, Morgan Langille, Thomas Sharpton, Kelly Kryc, Alex Koeppel and Guillaume Jospin. All researchers gave short presentations of their work including discussions on possible developments for the upcoming year. In addition we discussed multiple topics including protein family building methods, community profiling, Biotorrents, microbial ranges, null models, operational taxonomic unit, microbial and phylogenetic diversity, and phylogenetic co-binning. With the hiring of a new bioinformatics engineer we approached informatics issues as well as specific data requests. The PIs held a separate meeting with Kelly Kryc to discuss the annual report and other programmatic issues.
