Endy:Screening plasmid/v1.0/Characterization protocol
This is a work in progress, protocol is currently incomplete
Purpose
Characterize the performance of the 'empty' Screening Plasmid 1.0 (no inserted part) in CW2553+pJat8
Background
pJat8 provides Gen resistance and the screening plasmid has Amp resistance.
The current characterization protocol follows the following steps:
Day 1:
- Grow the cells overnight in Supplemented M9 to achieve density.
Day 2:
- Dilute back to return the cells to mid-log in Supplemented M9
- Innoculate experimental cultures of Supplemented M9
- After 1hr of growing induce with arabinose
Day 3:
- Harvest cells for FACS
- Run FACS (if cells are stored on ice @4C, this can be 1-2 days later).
Materials
- Supplemented M9 + 0.4% glycerol + Amp + Gent
- Filter-sterilized L-arabinose at concentrations of 0.001%, 0.01%, and 0.1%
Procedure
Day 1
Set up Overnights
Set up one 5ml overnight culture per device (empty/terminator/inverter) or control. Set up overnights early in the afternoon in Supplemented M9 + 0.4% glycerol + Amp + Gent and give them plenty of time to grow up.
- Controls (some typical sample data is shown below; results will vary depending on your flow machine)
- <bbpart>I13522</bbpart> - constitutive GFP
- (We have these results should link to the measurements here.)
- <bbpart>I13521</bbpart> - constitutive RFP
- (We have these results should link to the measurements here.)
- <bbpart>V1023</bbpart> - negative control (CW2553/pJAt8)
- (We have these results should link to the measurements here.)
- <bbpart>I13522</bbpart> - constitutive GFP
Day 2
Dilute back cultures in AM and grow until log phase
I generally dilute back 100x into 5ml of Supplemented M9 + 0.4% glycerol + Amp + Gent (no arabinose induction at this point) and grow for ~3-4 hours so the cells can reach log phase. During this time prepare tubes of Supplemented M9 + 0.4% glycerol + Amp + Gent and warm to 37C for the next step. Take the OD of the culture and determine the CFU/ml using calibration curve for your spec.

Set up overnight experimental cultures
Once you determine the CFU/ml dilute the experimental cultures to a concentration of 10^4 CFU/ml into the 7 tubes prepared previously. The controls will only need to be diluted into 0% arabinose. Allow the cells to grow for 1hr and then induce (this provides for more reliable induction) with with desired arabinose concentrations.
The arabinose concentrations (given in w/v) that provide a good range of induction are:
- 0%
- 10-6% (5uL of 0.001% in 5ml)
- 3x10⁻⁶% (15uL of 0.001% in 5ml)
- 10-5% (5uL of 0.01% in 5ml)
- 3x10⁻⁵% (15uL of 0.01% in 5ml)
- 10-4% (5uL of 0.1% in 5ml)
- glucose 0.4%
- This is really just a control for 'strong off' due to catabolite repression
Day 3
Prepare FACS Samples
Grow the cells for at least 12 hours (so they reach steady state) and then move the 5ml culture tubes directly to ice. Take 1 ml aliquots into polypropylene tubes and place on ice. Take OD of samples as well.
Run samples on FACS
- Print this sheet to take along to the FACS facility.
- Set PMT voltages based on the Empty plasmid control at full induction. The GFP and RFP signals should both be centered around 100 FLunits.
- The goal here is to take advantage of the full range of outputs from the device to get the best signal. It may make more sense in the future to move to higher PMT settings, since theoretically full induction of the empty plasmid control should be the highest readings we see in a terminator characteriation experiment (baring termiantors serving as promoters). However, apparently a voltage of <680 is prefered due to issues with the MOFLO (ask about how firm a limit this is).
- The droplet maker can be turned off to reduce noise in the signal if you are not sorting the cells.
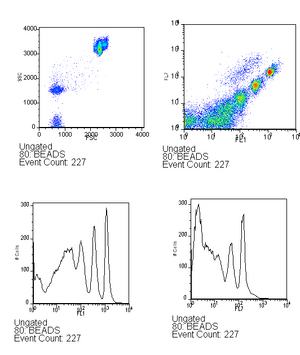
- Run beads (~6 drops in 500ml) - this is used to verify that the lasers are aligned as well as to serve as a calibration between runs, you can read more about this in the analysis techniques. Be sure to save the bead calibration data.
Beads should look approximately like this with good alignment. - Run the empty plasmid again, followed by the negative control.
- This allows you to determine the "noise region", since you shouldn't trust readings that are within the range of autoflourescence of your cells. Also, it makes sure that the method being used to clear the tubing between samples is working well. If you still see many positive cells in the negative control then you can try running bleach between samples. (This is maybe more important between different terminators then between different arabinose concentrations).
- Run the experimental samples. (have been collecting ~30K cells / sample)
Analysis
Contact
- protocol based on screening plasmid protocols developed by Josh Michener and Kelly Chang
