Dahlquist:GRNmap
From OpenWetWare
Jump to navigationJump to search

The protocol on this page has been replaced by the one on this page: Microarray Data Analysis Workflow. — Kam D. Dahlquist 14:32, 26 October 2016 (EDT)
Protocol for Running GRNmap through MATLAB
Start Up
- Make sure that you have a registered, working MATLAB program and then open it.
- Go to the File in the upper left hand corner of the program - or - you could hit the open folder below the Main toolbar.
The two options that will open a folder - Choose the Folder that holds the information that you want to have MATLAB utilize.

Using MATLAB
- Once the folder that is chosen, select the MATLAB file that holds the code for what will be run.
- After the MATLAB file has been selected a window will pop up
- Please note two things:
- The window that pops open is an Editor. The code can be altered in this window, and
- For the next step to work, the specific folder that holds the MATLAB file must be selected.
- Please note two things:
- In the Editor window, find the green play button beneath the Main toolbar. When you hit this, another window will pop up.
The Run button - Select the file you wish to use as the input into your chosen MATLAB code and press open.
- Depending on the year of your MATLAB software, the toolbar that signifies the program is processing your data may not be obviously available.

The Results
- Depending on what the input is, a figure will pop up and show the progress being made.
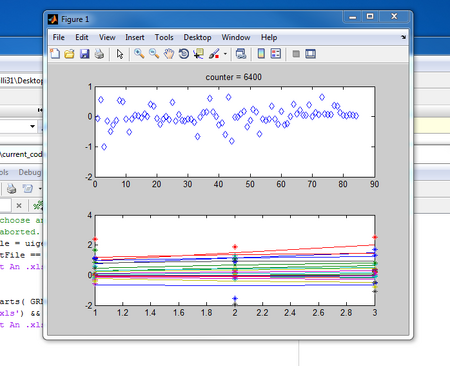
The progress window that may show up on the screen. - Again, the year of the MATLAB software may affect how quickly the output is produced.
- After the information has been completed, a window(s) will pop up with figures of the data that was inserted with their graphical interpretations.
- An Excel file will be saved that has the extrapolated data from the input with the output.
- Both this file and the figures/images are saved in the folder that the MATLAB and the input files were chosen from.

Spreadsheet
Input
This spreadsheet requires specific information to be put into MATLAB to extrapolate the calculations for the out. The systematic name the standard name of the transcription factors is included in the information until Network is reached. After Network, only the standard names are used. This information includes:
- Production rates
- The production rate is a numeric value. It states how much of a specific transcription factor is being produced.
- Degradation rates
- The degradation rate is a numeric value. It has the rate at which the transcription factor is being inhibited or degraded.
- Wt
- The wild type of the budding yeast with the times the measurements were collected at 15.00, 30.00, and 60.00 minutes.
- The numbers under these column coincide with the recovery time after cold shock and by what amount the transcription factor was being produced or degraded.
- dCIN5
- dCIN5 means the deletion of transcription factor CIN5
- With the deletion, the time measurements were the same - 15.00, 30.00, and 60.00 minutes.
- The numbers represent the amount the transcription factors were affected, either stimulation or inhibition, by the deletion of CIN5 after cold shock.
- dGLN3
- dGLN3 means the deletion of transcription factor GLN3
- The times measurements were collected at 15.00, 30.00, and 60.00 minutes.
- The numbers represent how much the transcription factors were affected after the deletion of GLN3 and cold shock.
- dHMO1
- dHMO1 means the deletion of transcription factor HMO1
- The time measurements were collected at 15.00, 30.00, and 60.00 minutes.
- The numbers represent how much the transcription factors were affected after the deletion of HMO1 and cold shock.
- dZAP1
- dZAP1 means the deletion of transcription factor ZAP1
- The time measurements were collected at 15.00, 30.00, and 60.00 minutes.
- The numbers represent how much the transcription factors were affected after the deletion of ZAP1 and cold shock.
- Concentrated Sigmas
- Network
- Network weights
- The genes controlling are the columns while the genes affected are the rows.
- The predicted networks are displayed with 1, being that the gene is affected by another, and 0 being that it has not influenced by another.
- Optimization parameters
- This sheet has information for MATLAB to use
- Stimulation times
- Starting from 0 and increasing in increments of 5 until it reaches 60, the times are when the data is being collected.
- Network_b
- This is the null hypothesis of the data in that it states that none of the genes impact any of each other.
Output
The document given as an output from Excel has new sheets that contain the following information:
- log2 concentrations
- The systematic name and the standard name are listed.
- The times that data was collected - 15, 30 and 60 minutes - are provided.
- Under these times, the log2 of the amount of transcription factor being produced or inhibited was taken.
- log 2 optimized concentrations
- Both the systematic and the standard names was used.
- The time period over which data was collected started at 0 and increased in increments of 5 until 60.
- Measurement times
- The three times data was collected are displayed - 15, 30, and 60.
- Network optimized weights
- The rows name the genes affected while the columns name the genes that are controlling.
- The number then correspond to whether the gene is being stimulated or inhibited by another, or if the controlling gene has no effect.
Links
- Back to Dahlquist on OpenWebWare or go to her home page Dahlquist Lab
- Back to User:Natalie Williams
