BME100 s2016:Group9 W1030AM L6
| Home People Lab Write-Up 1 | Lab Write-Up 2 | Lab Write-Up 3 Lab Write-Up 4 | Lab Write-Up 5 | Lab Write-Up 6 Course Logistics For Instructors Photos Wiki Editing Help | |||||||
OUR COMPANY
LAB 6 WRITE-UPBayesian StatisticsOverview of the Original Diagnosis System
What Bayes Statistics Imply about This Diagnostic Approach
Calculation 1&2The Bayesian statistic calculations for calculations one and two provided results that were in the 80-90% range. This shows that the PCR tests were 80-90% reliable in creating a correct diagnoses for the disease SNP. Calculation 3&4The Bayesian statistic calculations for calculations 2 and 3 produced results that went from 50% for the positive results to 80%-100% for the negative results. This shows that when the PCR diagnoses performed but the BME 100 groups were measured in conjunction with the doctor's diagnosis, the positive results were only 50% reliable where as the results for the negative results were much more reliable.
Sources of ErrorThree possible sources of error in the PCR detection process could have resulted from two categories of error in this experiment. For machine error, the first possible source of error in detection could have resulted from the reliance on the use of cell phone cameras to collect images for data analysis; the difference and reliability of each person's individual cell phone camera is so varied that results produced could be erroneous based solely on the difference in the images taken for analysis. The next machine error could have originated from the image j analysis software itself, as it can sometimes produce strange or erroneous results, and each time a measure is taken, no matter if its the same are in the same location of the same photo, it can provide inconsistent data measurements, showing that the software is not always 100% accurate. The final possible source of error, could come possible from human error, in which the group member perhaps did not interpret and copy data correctly between the image analysis software and the data analysis software (image j to excel). This would result in misreported results and as such the calculations would not be accurate. Intro to Computer-Aided DesignTinkerCAD TinkerCAD is an online computer program that allows the user to create their own 3D designs. For this experiment, our group used TinkerCAD to design a new and improved fluorometer that was much easier and much more accurate to use. TinkerCAD allowed the group to access templates, which was helpful in the brainstorming process. Another thing that is great about TinnkerCAD is that it allowed us to create our design quickly and effectively without too much difficulty. Compared to Solid Works, TinkerCAD is much more user friendly and much easier to use. However, it does not seem as accurate as Solid Works. Solid Works allows the user to add specific dimensions and materials, and while TinkerCAD allows for specific dimensions, it cannot change the materials used in the design. But for the purpose of this project, TinkerCAD was specific enough to convey the idea of our new design.
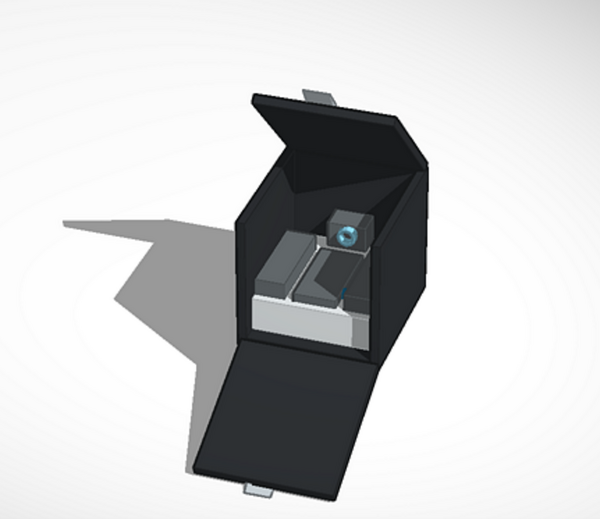
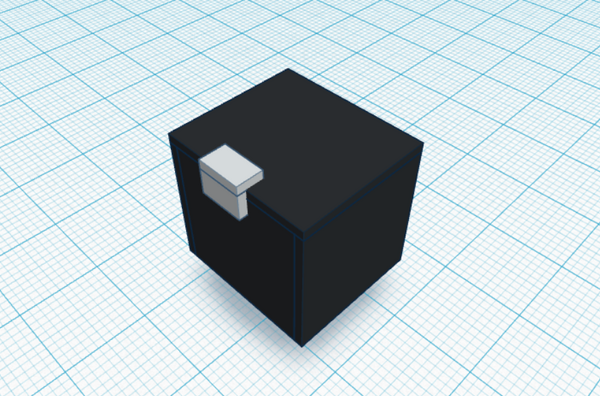
Feature 1: ConsumablesOne major weakness with the design of the consumables was the size of the micropipette. It was extremely difficult to try and place such a large device into a sample size that was as small as the plastic tubes. To improve this, the redesigned consumables package will include a smaller micropipette that contains the same level of accuracy as the large micropipette. The new design will be narrower and more compact, which will allow the user to avoid contaminating the product. This will be possible, because there will be less difficulty in placing the micropipette within the sample and there will be less adjustment. This will also allow for greater accuracy in the amount of the sample that the micropipette can pick up. Furthermore, it will contain a trigger that allows for less error in using the micropipette. There were a few times when the group was not successful in using the pipette to obtain any of the sample, and this could contaminate the sample when the micropipette comes into contact with sample for the second time. A trigger on the side that allows for automatic pipetting would allow for accuracy in obtaining the sample and would avoid contamination. The user only has to press the trigger, and the pipette will successfully obtain an accurate amount of the sample the first time. This will provide for less error and will allow for greater ease in using the product. Feature 2: Hardware - PCR Machine & FluorimeterPCR Machine- One major weakness in the PCR machine is that it is overly sensitive. This does allow for effective DNA replication, but it also means that almost anything can contaminate the sample especially something like a stray eyelash or a dead skin cell. Temperature can also affect how effectively the DNA replicates and it needs to be controlled carefully. With the lack of insulation it between the heating plate and the sample it is possible for the sample to get too hot or there is a chance for it to get too cold and prevent effective DNA replication. To improve the problems that were seen when dealing with PCR, the redesigned PCR machine will contain a thin metal screen that will catch contaminates such as dead skin, eyelashes, or anything that could possibly contaminate the sample. It will be connected with the heating plate, so that it can conduct the heat needed for the DNA to replicate. However, it will also provide added insulation between the heating plate and the sample. This will prevent the sample from getting too hot. Also, there will be extra insulation around for the plate where the tubes are housed. This insulation will prevent the temperature from getting too cold and affecting the DNA sample. With these improvements, the PCR machine will be a more effective way to replicate DNA. Fluorimeter- There were many issues with the fluorimeter. Firstly, there was no uniform camera system throughout the experiment. Some groups used a webcam, and some groups used a webcam. Also, the position from which the fluorimeter opened was was awkward and it was difficult to place the samples on the slides. The other problem with the fluorimeter was that the group had to constantly reopen the dark box in order to take new pictures. This could possibly hurt the effectiveness of the SYBER Green when it is exposed to light. It was also hard to position the camera in such way that the pictures were actually clear enough for analysis. To improve this, the group designed a fluorimeter with a built in camera that rests behind the housing of the slides. It is level with the slides so to prevent blurry or unclear pictures. This will make the pictures a lot easier to analyze. Furthermore, the newly designed fluorimeter will also have a button on the outside of the dark box that is attached to the camera. This will allow for taking multiple pictures without lifting the flap on the darkbox and preventing harm to the SYBER Green. The darkbox is also redesigned, so that it opens from the top instead of from the side. This will make it much easier to place the samples onto the the fluorimeter, and the samples will be more likely come together in a cohesive beach ball shape rather than retaining no shape at all. This newly designed fluorimeter will allow for greater accuracy and greater ease of use.
| |||||||


