BME100 s2016:Group9 W1030AM L3
| Home People Lab Write-Up 1 | Lab Write-Up 2 | Lab Write-Up 3 Lab Write-Up 4 | Lab Write-Up 5 | Lab Write-Up 6 Course Logistics For Instructors Photos Wiki Editing Help | |||||||
OUR TEAM
LAB 3A WRITE-UPDescriptive StatisticsMean
Results
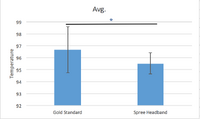
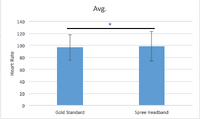
AnalysisA T-Test was used to make comparisons between two groups, one for heart rate and one for temperature. A Pearson function was used to determine the correlation coefficient between the pulse ox and the Spree, as well as the oral thermometer and the Spree headband. For the blood pressure correlation between the Pulse ox and the Spree, the coefficient was 0.633616121. This means that, while there was a positive correlation between the Spree and the gold standard, there was not enough correlation to make the device valid when looking at blood pressure readings. The Pearson function for temperature correlation yielded a coefficient of 0.192798089, which shows very low correlation between the control and the Spree headband. This means that the headband was not valid for temperature readings.
Summary/DiscussionThere were several design flaws with the Spree Headband device that made it difficult for users to use. For example, the application would not connect to the headband through the bluetooth setting. In addition to this, navigating through the application itself was confusing for users when trying to locate the right screen that displayed information such as heart rate and temperature. This could be improved by making the application very user friendly and easy to understand. The display for the temperature was also a flaw because it displayed a meter with different colors representing different temperature ranges, rather than giving an exact temperature. Providing an exact body temperature, as a thermometer does, would be a better alternative for users.
The PeeHD"A pee once a day keeps the doctor away" Target Population and NeedThis product is aimed for health conscious adults, ranging from mid-twenties to seventy-five, who are concerned with problems such as diabetes, infection and kidney stones. In addition to this, this product will be available to a group that does not feel comfortable taking urine samples outside of their home setting. With this, users will also not need to make as many visits to the doctor for urine tests. Due to the product being connected to an app, the target population would also need to have cellphone or tablet access. The product will help the user detect a variety of diseases and help them maintain a healthy diet that is specific to them.
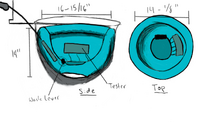
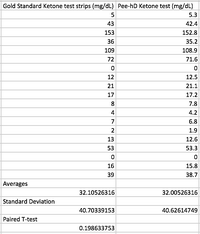
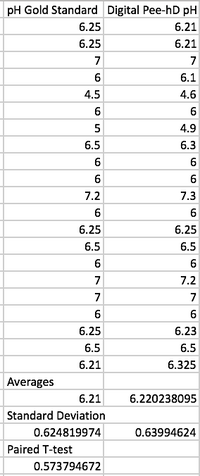
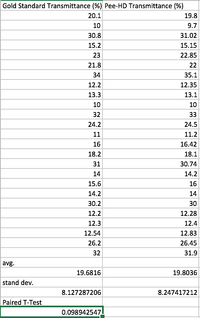
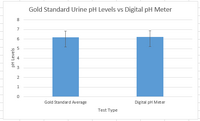
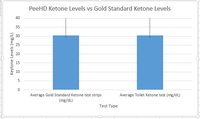
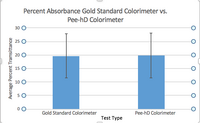
Device DesignThe Pee-hD will be a self cleaning, automated system, that when implanted in a toilet catches urine put into it by the consumer, and tests it using a digital pH meter, a colorimeter(to measure how clear the urine is and determine hydration), and refillable unit that uses ketone strips to test ketone levels in the urine sample. When the urine is done being tested, the Pee-hD releases the sample into the toilet and cleans itself with solution and water provided by the toilet flush. Inferential StatisticsData sets showing the project variance between results of urine tests given by widely used gold standard devices, a digital pH monitor, a colorimeter, and ketone test strips, and the version of these devices used in the Pee-hD. All p-values found through T-tests were greater than .05, therefore there was not a significance in difference between the data sets. Graph |
|||||||

