BME100 s2016:Group8 W1030AM L6
| Home People Lab Write-Up 1 | Lab Write-Up 2 | Lab Write-Up 3 Lab Write-Up 4 | Lab Write-Up 5 | Lab Write-Up 6 Course Logistics For Instructors Photos Wiki Editing Help | ||||||
OUR COMPANY
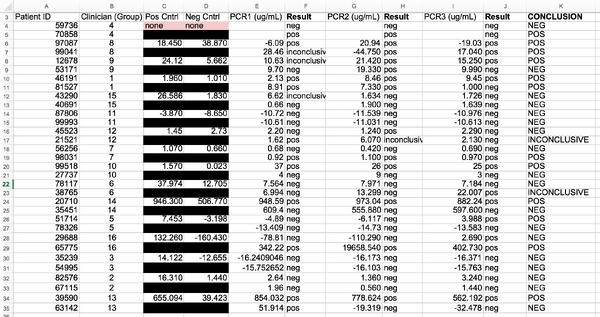
LAB 6 WRITE-UPBayesian StatisticsOverview of the Original Diagnosis System In order to test patients for the disease-associated SNP, sixteen groups in the BME 100 laboratory course, each consisting of multiple students, tested 32 individual patients, using PCR, polymerase chain reaction. In order to do this, DNA samples were taken from each of the patients and distributed evenly between the groups, so that each group was given two different DNA samples. Each patient’s DNA sample was also tested multiple times in order to ensure that the same result occurred for the different samples, which would minimize error in calculations. To complete the PCR each DNA sample was placed into a tube using a pipette and given buffer solutions before placed in an PCR machine in order for the process to take place. Both PCR negative and positive controls were used as well, in order to minimize error. Following the PCR reaction, pictures were to be taken of each solution on a glass slide. In order to correctly asses the data from each sample, SYBR Green I solution was added to the samples and multiple pictures of each sample, three to be specific, were taken in order to prevent unwanted error. The use of multiple images for each drop, instead of one, ensured that error would be minimized considering that slight differences in angles/distances of the camera from the drop were accounted for, and that all data was assessed the same way. After the pictures were taken of the samples, a program named ImageJ was used. When using ImageJ, the calibration controls were used specifically in order to prevent unwanted error. While assessing the drops, oval calibration images were used so that the system could detect between the different colors of the drop and was able to compare the samples tested to a calibration oval drop. After using ImageJ to collect the Mean Pixel Value, Area, and RAWINTDEN data for each of the drops of the samples, the background of each image was collected and subtracted from the RAWINTDEN values to produce a final value. After, the mean of all the final values was taken so that the standard deviation could then be calculated in order to compare the samples to calibration calf thymus samples. Moreover, after each lab group completed this process for their individual DNA samples, each group was required to place their data into a class database so that all data could be compiled and assessed as a whole. As a class, it was calculated that 96 total PCR’s were run giving 36 positive PCR results and 56 negative PCR results. Given this data and subtracting any inconclusive results (as labeled “inconclusive”), 32 total conclusions were made from the class, which can be seen below in the table.
What Bayes Statistics Imply about This Diagnostic Approach In calculation 1, the probability that a test conclusion would come out positive was calculated to be very small, which was the same calculated value that a patient would receive a positive PCR result as well. Given both of these values, it was determined that there was a very large chance that a patient would receive a positive result for the disease given both a positive test conclusion and positive PCR result. In conclusion, this calculation proves that in order to most correctly diagnose a patient with a positive disease conclusion, a positive PCR result is the most accurate way to do so.
Calculation 2: Probability patient will get negative test conclusion given a negative diagnostic result. Calculation 3: Probability patient will contract disease given positive test conclusion. Calculation 4: Probability patient will contract disease given negative test conclusion. There are multiple ways that human or machine error could have resulted in harming the Bayes values calculated in this experiment. One error could be a discrepancy in the amount of Polymerase Chain Reaction used, the amount of patient sample as well. Another source of error could be the camera used when taking photos which could skew results as well by taking photos from different angles or distances by accident. Another source of error could be an incorrect mixing of the PCR and sample by the machine which would produce discrepancies. Additionally, there could be error from the pipetting as well due to unwanted contamination of the chemicals or pipette itself. Lastly, there could be error when reading the results from the pictures or values as well.
Intro to Computer-Aided DesignTinkerCAD
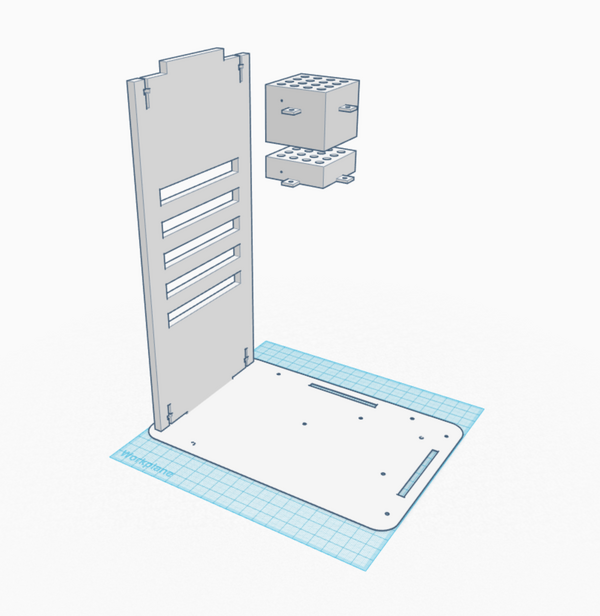
We chose to make the PCR machine with an additional tray for PCR tubes to allow a scientist to test more samples at once. This design change increases the time efficiency of the machine. However, by adding an additional tray, we also had to add a metal block between the trays to conduct the heat produced by the heating element to the top tray in order to avoid a loss in functionality. These additional components would require the sides of the machine to be extended upward, which is a simple alteration of the design. This was also a better option than adding more holes in a single tray because this way the extra dimension is in the vertical direction, meaning no extra lab bench space is required. We also chose to make the exterior casing out of a clear material so that a student would be able to see the inner workings of the machine in order for them to have a better understanding of how the machine works.
Feature 1: ConsumablesConsumables Package:
Feature 2: Hardware - PCR Machine & FluorimeterBoth the fluorimeter and the Open PCR machine are included in our design. The Open PCR machine was redesigned to hold an extra tray of PCR tubes because the problem with the PCR machines in the lab was that the class needed 8 machines to run the 16 groups' tubes. By doubling the number of tubes the machine can hold, the number of required machines would be halved without increasing the amount of time required to run the same number of samples. It was also made out of a clear casing for increased educational opportunities. By making the machine transparent, students would be able to more clearly see the internal components of the PCR machine to better understand the machine's functions and how it is able to accomplish those tasks.
| ||||||


