OUR TEAM
LAB 5 WRITE-UP
PCR Reaction Report
The pre-lab helped us to correctly pippete our samples. Without it we could've possibly mishandled and cross contaminated our samples. The final reactions didn't have the same amount of liquid. There was trace amounts of liquid left in the tubes, but not a significant amount. We didn't have to change our labeling scheme.
Fluorimeter Procedure
Web camera set-up
Take the camera stand and place it next to fluorometer. Put phone on stand and set it up to take pictures of sample so that the picture is clear and close up.
Placing Samples onto the Fluorimeter
- Step 1: Place necessary amount of SYBR green onto middle of first two dot rows.
- Step 2: Place neccesary amount of DNA sample into the SYBR green dot
- Step 3: Align the slide so the fluorescent light shines into the optic piece on other side
- Step 4: Put cover box over system.
- Step 5: Set camera timer to 3 seconds and take picture, making sure to use the cover box to block out light
- Step 6: Take 3 pictures for each sample.
Data Collection and Analysis
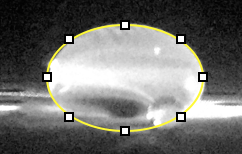
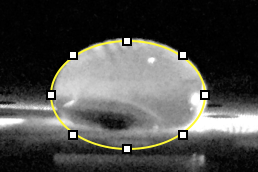
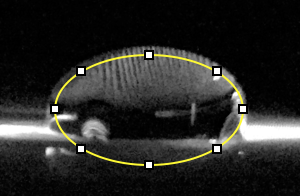
Images of High, Low, and Zero Calf Thymus DNA
High
Low
Zero
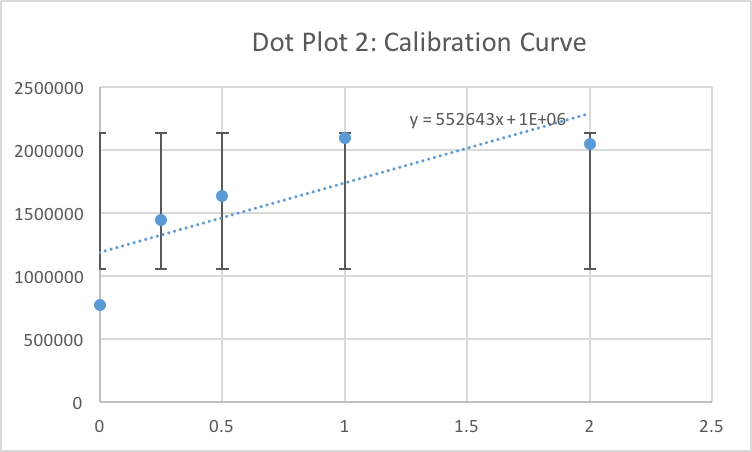
Calibrator Mean Values
Calibrator Mean Values
| Initial Concentration of 2X Calf Thymus DNA solution (micrograms/mL)
|
Final DNA concentration in SYBR Green I solution (µg/mL)
|
Sample Number
|
RAWINTDEN DRO-BACKGROUND
|
Mean
|
Standard Deviation
|
| 5
|
2.5 |
C-1 |
2186129 |
2188483 |
2191151 |
2188587.667 |
2512.635535
|
| 2
|
1 |
C-2 |
2056335 |
2042466 |
2040840 |
2046547 |
8515.555002
|
| 1
|
.5 |
C-3 |
2087348 |
2088135 |
2102797 |
209276 |
8701.199285
|
| .5
|
.25 |
C-4 |
1643382 |
1627741 |
1625240 |
1632121 |
9832.158512
|
| .25
|
.125 |
C-5 |
1420245 |
1441205 |
1449159 |
1436869.667 |
14936.57207
|
| 0
|
0 |
C-6 |
767545 |
808998 |
716664 |
764402.3333 |
46247.15293
|
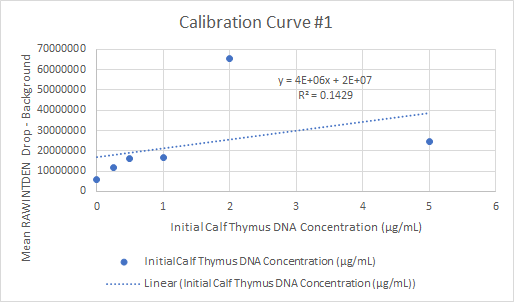
Calibration curves
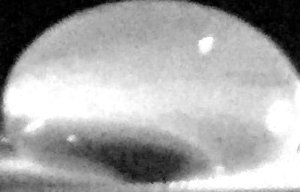
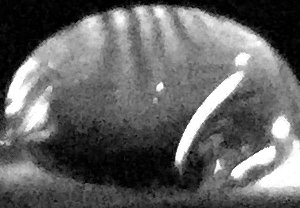
Images of Our PCR Negative and Positive Controls
Positive
Negative
PCR Results: PCR concentrations solved
PCR concentrations solved
| PCR Product Tube Label
|
MEAN (of RAWINTDEN DROP - BACKGROUND)
|
"PCR Product Concentration (µg /mL)
(Step 5 calculation)"
|
Total Dilution
|
"Initial PCR Product Concentration
(µg /mL)
(Step 6 calculation)"
|
| G7+
|
8154383.333 |
12.94575944 |
0.08335 |
1.079029049
|
| G7-
|
5398040.667 |
7.958194833 |
0.08335 |
0.6633155393
|
| G7 1-1
|
5527930.333 |
8.193228419 |
0.08335 |
0.6829055887
|
| G7 1-2
|
3753018.667 |
4.981549874 |
0.08335 |
0.415212182
|
| G7 1-3
|
5557640.333 |
8.246988261 |
0.08335 |
0.6873864715
|
| G7 2-1
|
7128031.667 |
11.08859004 |
0.08335 |
0.92423398
|
| G7 2-2
|
8313322 |
13.2333568 |
0.08335 |
1.103000289
|
| G7 2-3
|
7451784.333 |
11.67441609 |
0.08335 |
0.9730625814
|
PCR Results: Summary
- Our positive control PCR result was 12.946 μg/mL
- Our negative control PCR result was 7.958 μg/mL
Observed results
- Patient 56256 : The images from patient 56256 looked like the negative control, and had a PCR concentration of ~ 8 microliters.
- Patient 98031 : The images from patient 98031 looked like the positive control, and had a PCR concentration of ~ 12 microliters.
Conclusions
- Patient 56256 : Patient 56256 appeared to test negative, from analysis of data.
- Patient 98031 : Patient 98031 appeared to test positive, from analysis of data.
|  BME 100 Spring 2016


