BME100 s2016:Group5 W1030AM L3
| Home People Lab Write-Up 1 | Lab Write-Up 2 | Lab Write-Up 3 Lab Write-Up 4 | Lab Write-Up 5 | Lab Write-Up 6 Course Logistics For Instructors Photos Wiki Editing Help | |||||||
OUR TEAM
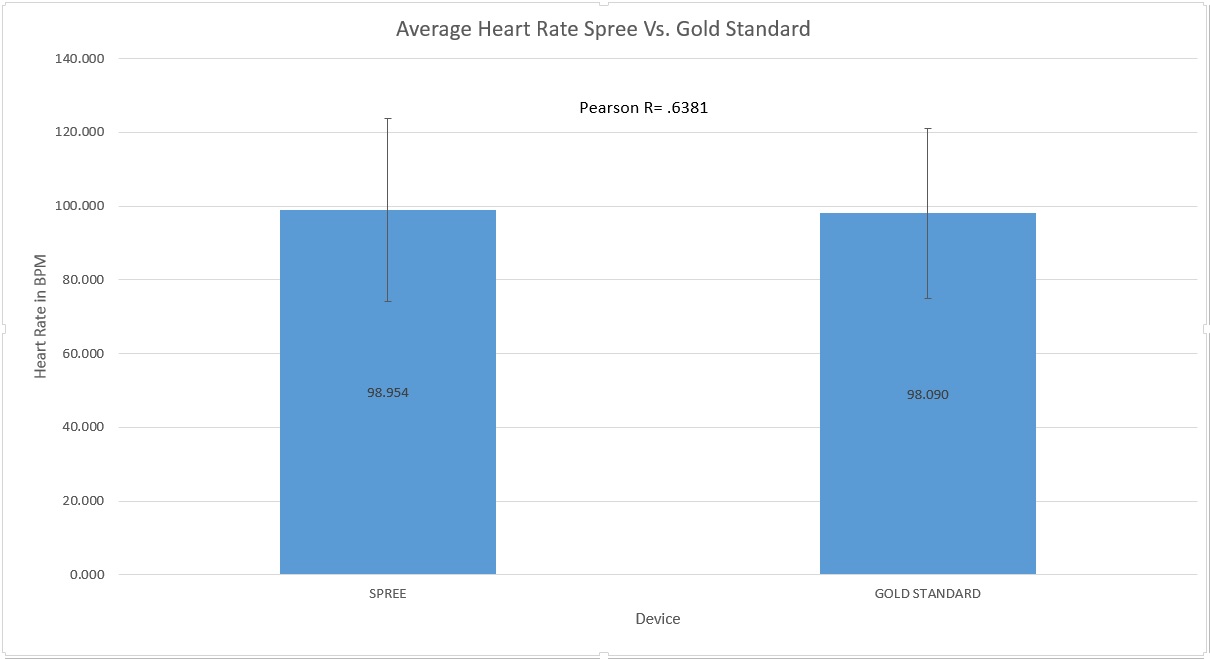
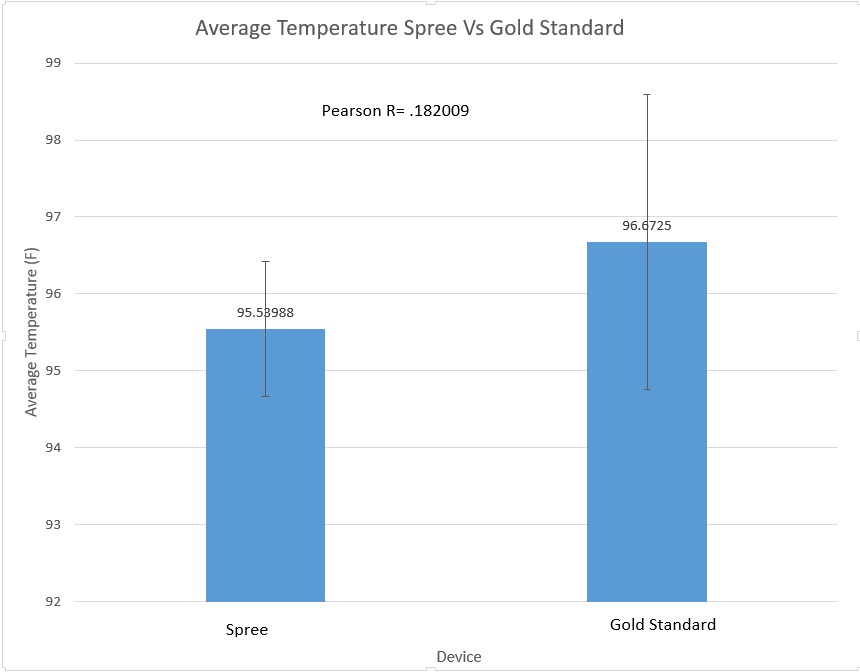
LAB 3A WRITE-UPDescriptive StatisticsTemperature: Gold Standard: mean-96.6725°F Spree Headband: mean-95.53988°F Gold Standard: standard deviation-1.918463°F Spree Headband: standard deviation-.87527°F Gold Standard: standard error-0.106254°F Spree Headband: standard error-0.048476°F Heart Rate: Gold Standard: mean - 98.090 bpm Spree Headband: mean - 98.954 bpm Gold Standard: standard deviation - 23.030 bpm Spree Headband: standard deviation - 24.877 bpm Gold Standard: standard error - 1.323 bpm Spree Headband: standard error - 1.429 bpm
Results
AnalysisTemperature Gold Standard Spree Headband Variance 3.680498537 0.766097216
The gold standard, an oral thermometer, had almost no correlation to the spree headband. The Pearson correlation is approximately 0.2. While the means were similar, the devices had no correlation. The Pearson's R is less than 1 indicating that there is little correlation between the two sets of data. As such the accuracy of the spree headband is doubtful.
T test p value = .657460 Pearson Correlation = .63812443 With the p value from the T-test being greater than .05, there was no statistical significance between the gold standard and spree headband. The spree headband shows a moderate positive correlation with the gold standard in regards to heart rate. The Pearson correlation was greater than .5 but less than .7, so we can see that there was a moderate correlation but not a strong positive correlation, although the means were similar for the two devices.
Summary/DiscussionThe spree headband proved to be inaccurate in measuring temperature and moderately accurate in measuring heartrate when compared to the gold standards. The accuracy in heartrate was still not statistically significant when compared to the gold standard. Accuracy in these readings would be the first place to improve the device. There were also some other features of the device that could use improvement as well. The band for wearing the device gets uncomfortable and leaves the user with a red mark on their forehead. The heart rate on the device malfunctioned and dropped down to 44 bpm during one of the testing intervals, but steadied by the time we recorded the measurement. We also had some issues linking the device with the phone application, there must be a better way to label the devices for linking. Overall, the device has some functional features and physical features that need to be addressed.
LAB 3B WRITE-UPTarget Population and NeedThe population that is being targeted for our device is people over the age of 40, specifically, elderly that are at risk for heart disease. More than 600,000 people die from heart related diseases every year. Poor diet is a main contributor to heart disease. People need a way to watch their diet that is specific to them.
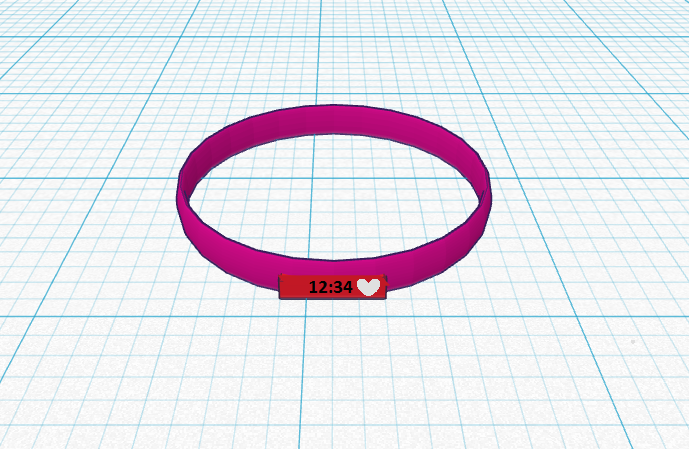
Device DesignDiet Watch -Stay healthy, Stay Happy
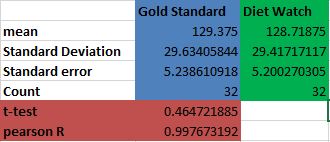
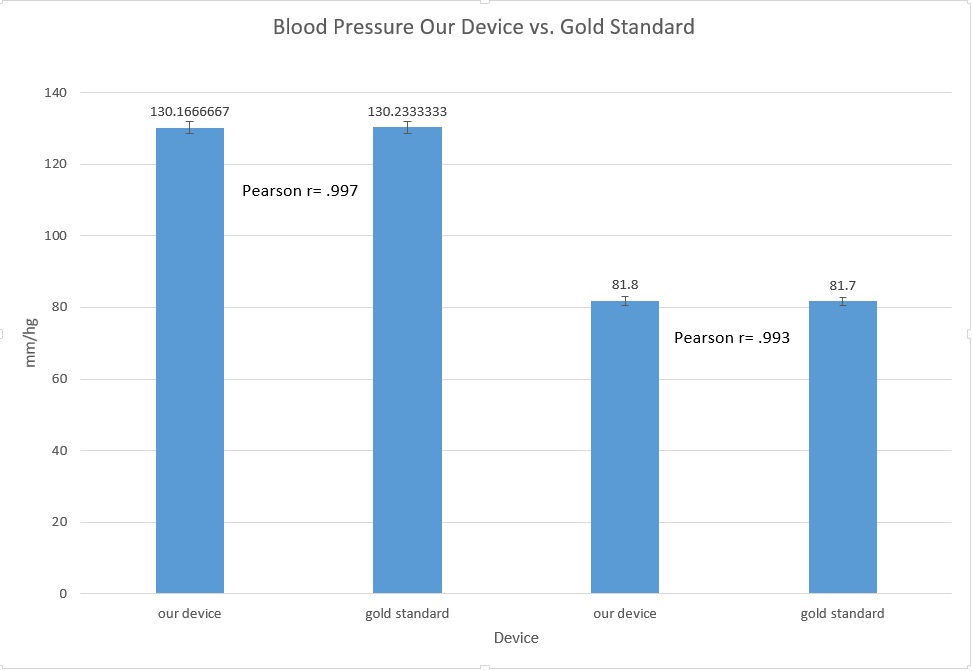
Inferential StatisticsBlood Pressure Diet Watch vs Gold Standard Systolic P Value = .978 Systolic Pearson R = .997 Diastolic P value = .951 Diastolic Pearson R = .993 Both the P value and Pearson coefficient show that there is a very strong, positive correlation between our Diet Watch and the Gold standard (a sphygmomanometer).
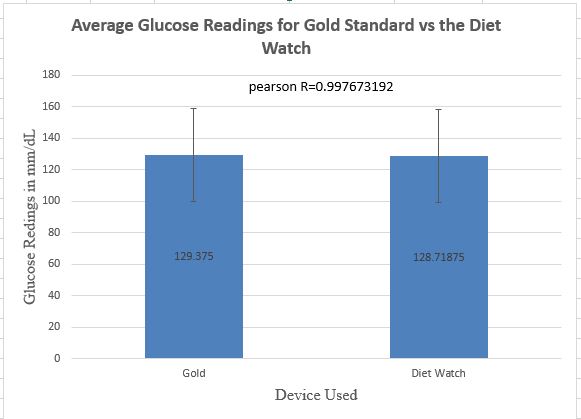
Blood Glucose Levels (in mm/dL) Inferential Statistics
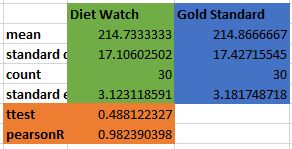
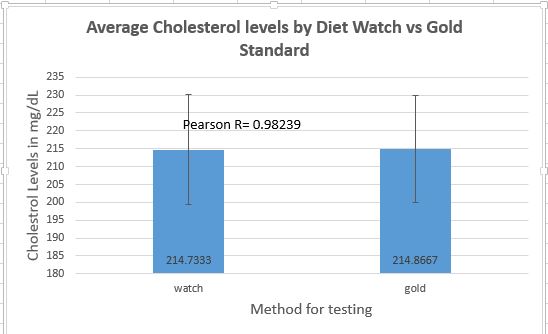
Cholesterol Levels (in mm/dL) Inferential Statistics
GRAPHS
|
|||||||

