BME100 s2016:Group4 W1030AM L3
| Home People Lab Write-Up 1 | Lab Write-Up 2 | Lab Write-Up 3 Lab Write-Up 4 | Lab Write-Up 5 | Lab Write-Up 6 Course Logistics For Instructors Photos Wiki Editing Help | |||||||
OUR TEAM
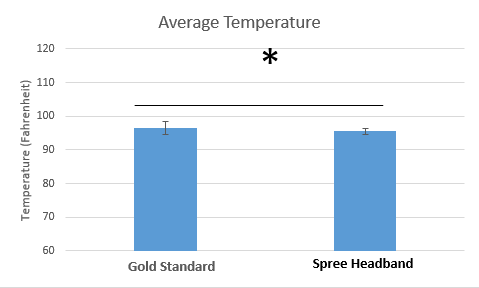
LAB 3A WRITE-UPDescriptive StatisticsMean temperature Spree: 95.53086 Degrees F Mean temperature Gold: 96.65025 Degrees F
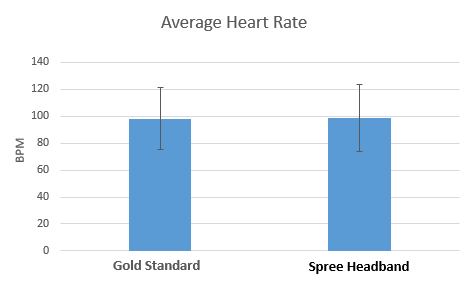
Mean pulse Gold: 98.0898 BPM
Standard Deviation temperature Gold: 1.921162 Degrees F
Standard Deviation pulse Gold: 22.99251 BPM
Standard Error temperature Gold: 0.10673 Degrees F
Standard Error pulse Gold: 1.320885 BPM
Results
AnalysisT-Test pulse: 0.658811 Pearson's R pulse: 0.69527 A T-Test of ~.66 indicates that there is no statistical significance between the two sets of data. A Pearson's R of ~.7 indicates a reasonable correlation between the two sets of data.
Pearson's R temperature: 0.193142 A T-Test of <.05 indicates that there is a statistical significance between the two sets of data. A Pearson's R of ~.2 indicates that there is little correlation between the two sets of data.
Summary/DiscussionPotential device flaws include: connection problems, uncomfortable, unsightly, and imprecise readings. One of the connection problems encountered was initial connection between the device and the app. This could cause problems especially when around other devices as sometimes the devices interfere with each other or disconnect completely. A potential solution to this problem would be to have the device record the data to later be uploaded onto a computer similar to a fitbit. After an extended period of time wearing the device, over an hour, it starts to become uncomfortable and ultimately lead to a pressure headache. This problem can be fixed by adding more padding or simply moving the device to a different location on the body such as the wrist or ankle. The device looks unnatural in the gym environment, to deal with this problem it could be designed to look more like a sweatband or moved to another location on the body. The temperature scale on the device was solely color coded ranges and therefore imprecise. One solution for this problem is to include a more accurate system of measurement for temperature in the device.
LAB 3B WRITE-UPTarget Population and NeedThe target population for the USTEP is athletes who want to improve their running form and reduce risk for injury. This includes professional athletes as well as novice runners. The age range that USTEP aims to address is 15 to 45 year olds. Research indicates that about 60.5 million Americans participate in some form of running and this is the population the USTEP targets. Anyone who is concerned about running injuries such as stress fractures and shin splints could benefit from our product. Running injuries are very prevalent within the running community which indicates that there will be great need for our product. The target population will need to product to be accurate, practical, and comfortable. It is important that the device is accurate because the runner needs to know precisely how to adjust their running gait in order to prevent injury. If the device is inaccurate the runner could get injured. The device needs to be practical and easy to use so that the runner is inclined to use the device for every run. If the device is too complicated and difficult to use the runner might opt out of using the device. It is imperative that the device is comfortable so that runner will prefer our product over any other running shoe.
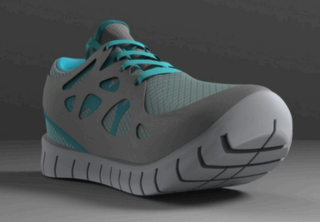
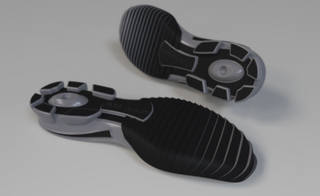
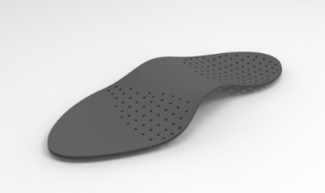
Device Design
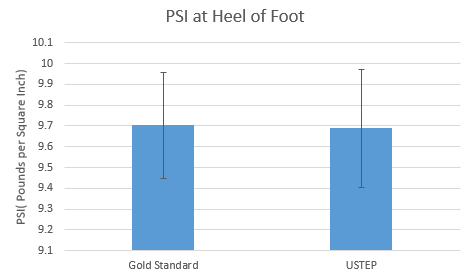
Inferential StatisticsT-Test: 0.873 Pearson's R: 0.880 A T-Test of 0.873 indicates that there is no statistical significance between the gold standard and the USTEP. A Pearson's R of 0.880 indicates a strong correlation between the gold standard and the USTEP. The high correlation between the gold standard and the USTEP indicates that the USTEP is a reliable measurement of PSI and our product is accurate.
Graph
|
|||||||

