BME100 s2016:Group16 W1030AM L6
| Home People Lab Write-Up 1 | Lab Write-Up 2 | Lab Write-Up 3 Lab Write-Up 4 | Lab Write-Up 5 | Lab Write-Up 6 Course Logistics For Instructors Photos Wiki Editing Help | |||||||
OUR COMPANY
LAB 6 WRITE-UPBayesian StatisticsOverview of the Original Diagnosis System
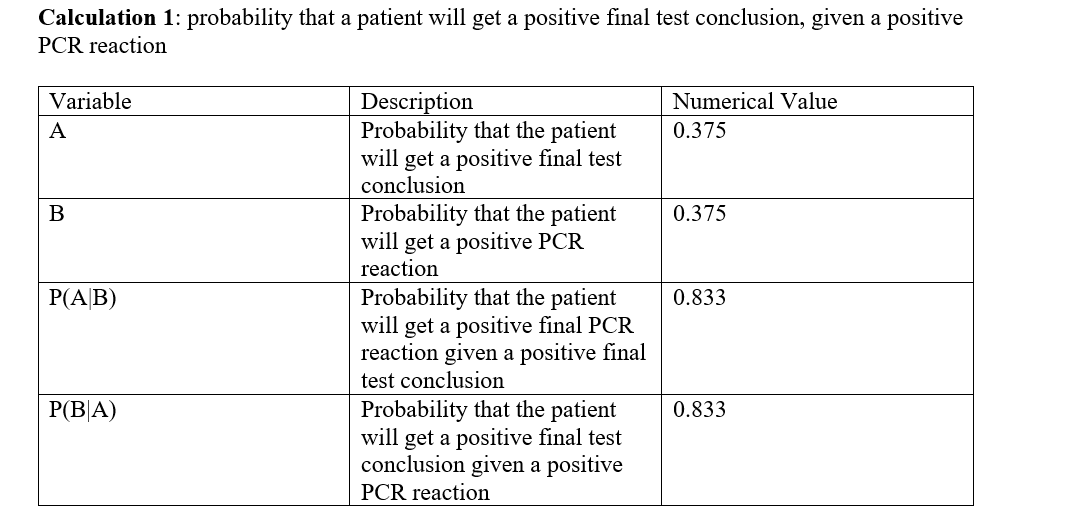
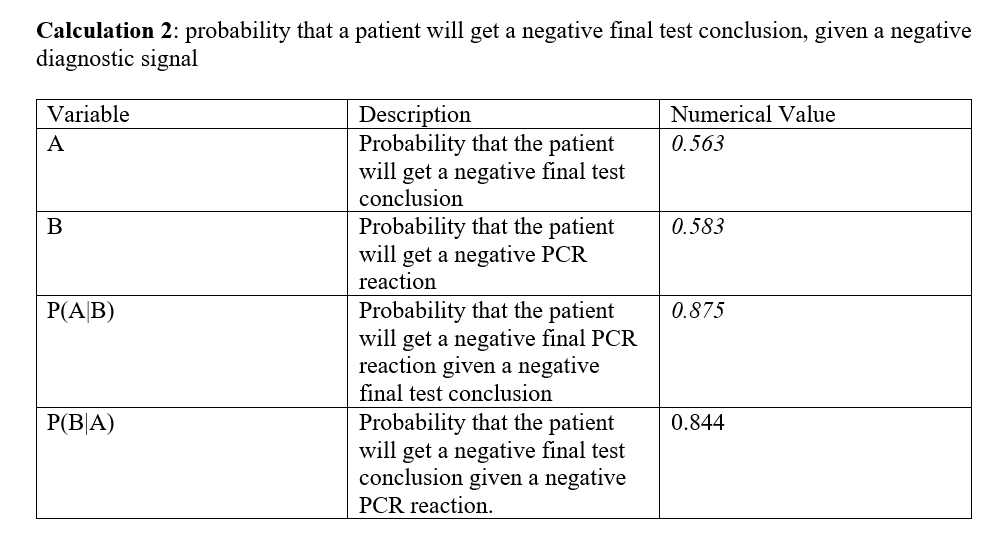
Overview of the Original Diagnosis System In this experiment, 16 teams in BME 100 examined the DNA samples of 32 patients, and three replicates DNA samples, summing up to 96 samples in total, were taken for each patient to eliminate the sources of error, and have a good prediction of whether this patient will develop the disease or not. The disease is mainly caused by single nucleotide polymorphism (SNP), so the teams used PCR reaction to detect the SNP. 50 µL of each of the patients’ samples was added to a new tube, with 50 µL of the primer mix plus the PCR mix added to each one. The tubes were then labeled properly, closed tightly, and then placed in the OpenPCR Machine which has made the samples go through the repeating cycles of the heating, and cooling cycles of PCR reaction to copy specific regions in the DNA. The cycles start with the heated lid which was 100 Co, then the initial step which is at temperature of 95 Co for 2 minutes. At this temperature, the DNA strands get denatures meaning that each double stand DNA get separated in two single stranded DNA. Afterwards, the temperature is lowered to 57 Co for 30 seconds, so the primers bind to complementary sequences of DNA for, and at slightly higher temperature, which is 72 Co for 30 seconds, the enzyme TAC polymerase binds to the primer sequences, and adds nucleotides to extend the strands, then the samples are hold at temperature of 4Co, then the cycles get repeated over, and over to further create more copies of the desired DNA. Positive, and negative controls were made as well in order to compare all the DNA samples with them to see if the collected results are logical, and to test if PCR has been done properly. Then, SYBER green were added to the samples, and the samples were taken look at them in the fluorimeter box which emitted a light through the samples’ droplets. 3 images were taken for each droplet per unique PCR sample to reduce sources of error, and to get the most possible accurate results. Then, a calibration curve was set up using the information collected from ImageJ for samples with known DNA concentrations. Then, the calibration curve allows to know the DNA concentrations of the patients whose DNA concentrations were unknown. Among all the teams, only 2 samples were inconclusive, while there were other 30 successful results. There were 12 patients with positive conclusion for the DNA test, and 18 other patients with negative conclusion for the DNA test. There were various sources of error in this experiment that may have affected the final results. One of the major sources of error is the micro pipetting techniques. Since this experiment was really sensitive to small changes, adding the improper amounts of the reactants might have caused a great error shift. What Bayes Statistics Imply about This Diagnostic Approach Bayes Statistics In calculation 1, the calculated probability that the patient will get a positive final test conclusion was calculated, and found very small. Similarly, the calculated probability that the patient will get a positive PCR reaction was found to be small as well. By using those probabilities, the Probability that the patient will get a positive final PCR reaction given a positive final test conclusion, and the probability that the patient will get a positive final test conclusion given a positive PCR reaction was found to be very large; the values of those probabilities were found to In calculation 2, the probability that the patient will get a negative final test conclusion was found to be near 50%, the same was for the probability that the patient will get a negative PCR reaction which was found to be near to 50% as well. Given those probabilities, both the probability that the patient will get a negative final PCR reaction given a negative final test conclusion, and the probability that the patient will get a negative final test conclusion given a negative PCR reaction were found to be very large, near to 90%, and 80% respectively. In sum, it can be concluded that negative PCR result is more reliable in predicting a positive disease conclusion than the positive PCR result due to the noticeable correlation between the negative PCR result, and the final test conclusion. However, both the positive, and the negative PCR results can be considered very reliable to predict the positive, and the negative final test
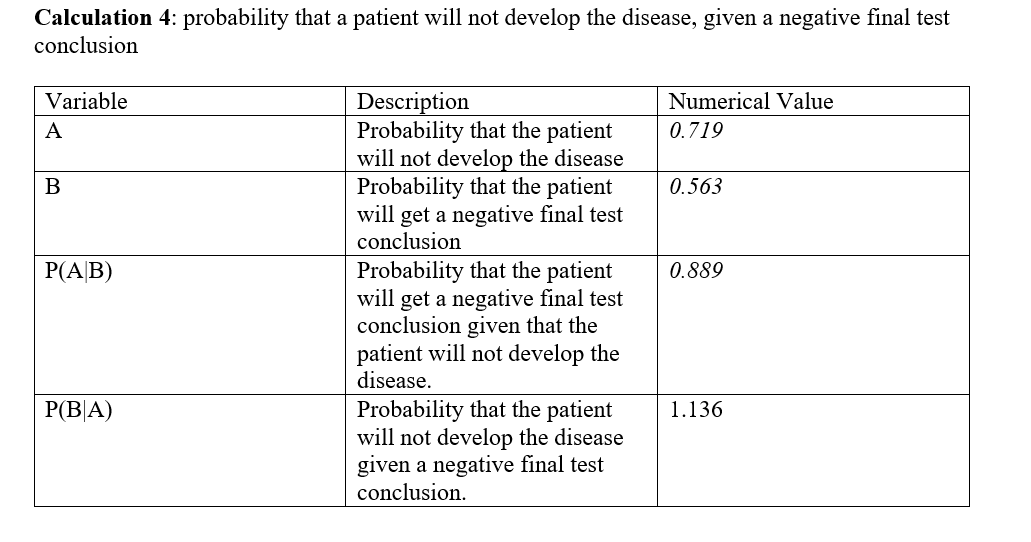
For calculation 3, the calculated probability that the patient will develop the disease was found to be very small, less than 30%. Further, the calculated probability that the patient will get a positive final test conclusion was found to be slightly higher, but still about to 40%. Using those probabilities, the probability that the patient will get a positive final test conclusion given that the patient will develop the disease was found to be exactly 50%, while the probability that the patient will develop the disease given a positive final test conclusion was found to be less than 50%. It can be included that using PCR final result in predicting the development of the disease For calculation 4, the calculated probability that the patient will not develop the disease was found to be very high, close to 70%, while the probability that the patient will get a negative final test conclusion was found to be slightly less than that, which was close to 50%. Given those probabilities, both the probability that the patient will get a negative final test conclusion given that the patient will not develop the disease, and the probability that the patient will not develop the disease given a negative final test conclusion were really high, close to 1.00. In conclusion, the positive PCR results are not reliable in predicting the development of the disease. However, the negative PCR results were very reliable in predicting the development of the disease with much greater accuracy.
Intro to Computer-Aided DesignTinkerCAD
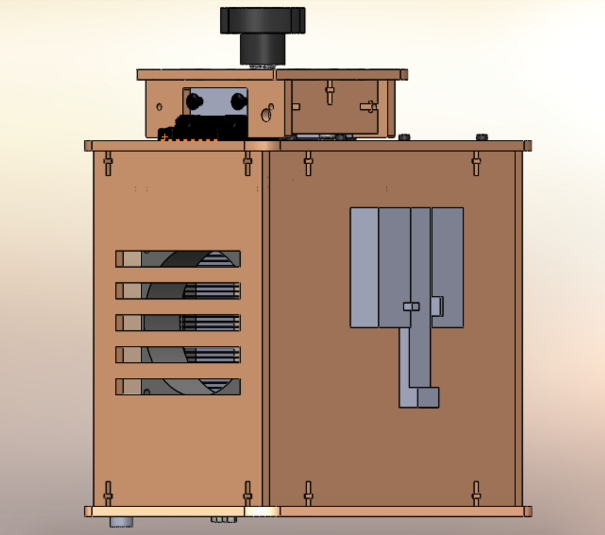
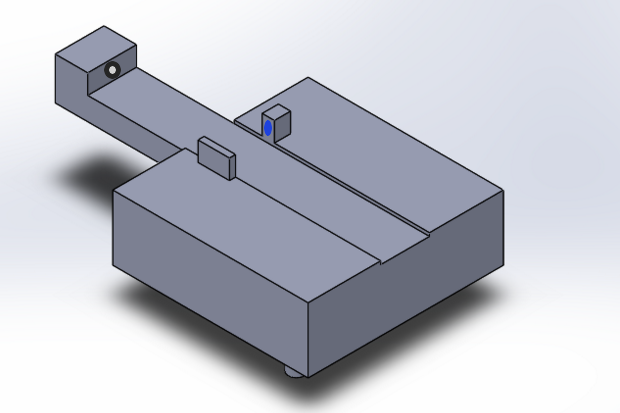
Feature 1: ConsumablesCrucial Consumables: Standard glass slides Primer solution SYBR Green Solution PCR mix Buffer solution Custom opaque black plastic tubes for SYBR Green solution Standard Plastic tubes Feature 2: Hardware - PCR Machine & FluorimeterThe OpenPCR machine can be purchased or built with online schematics, and slightly altered in order to incorporate our new fluorimeter. The major redesign was the fluorimeter itself, especially the camera component, as most of the issues we encountered were from placing the camera. With this new fluorimeter, the camera is built in, along with Blutooth capacity that allows the images to be taken and recorded remotely. The user simply places the droplet on the slide, aligned with the laser, and covers the fluorimeter. The image live streams to an app on the phone, and snapshots can be taken remotely. This process eliminates the constant movement of the camera and blackbox, and allows for more consistent and accurate pictures. The entire unit is waterproof, and coated in a silicon spray that eliminates the need for major cleaning. We also redesigned the plastic tubes for the SYBR Green solution to be opaque, as to not affect the light sensitive solution.
| |||||||


