BME100 s2016:Group15 W1030AM L3
| Home People Lab Write-Up 1 | Lab Write-Up 2 | Lab Write-Up 3 Lab Write-Up 4 | Lab Write-Up 5 | Lab Write-Up 6 Course Logistics For Instructors Photos Wiki Editing Help | |||||||||||||||||||||||||||||||
OUR TEAM
LAB 3A WRITE-UPDescriptive StatisticsHeart Rate Statistics
Temperature Statistics
Results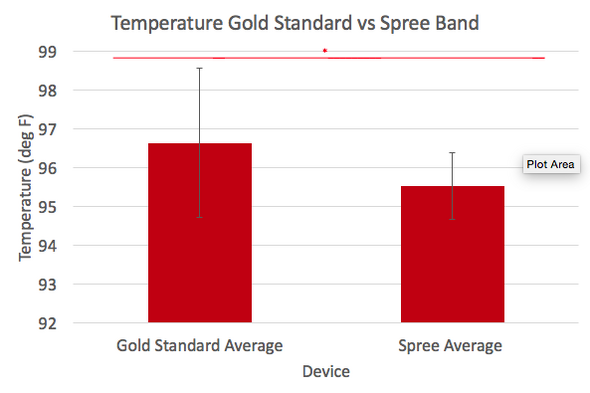
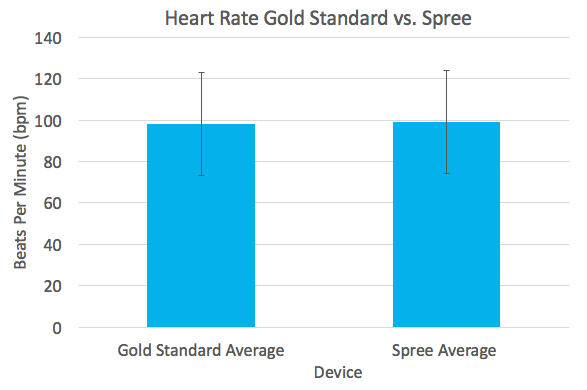
AnalysisTemperature Inferential StatisticsIn terms of Temperature, the value of the Pearson’s R value of the oral thermometer and Spree Band was .192 demonstrating a minimal correlation. The p value was 1.09*10^-21, which is less than .05. This demonstrates that the device is not accurate due to the standard R value being from .9-1, because there was a significant difference between the Spree Band and the gold standard according to the p value. Heart Rate Inferential StatisticsIn terms of Heart Rate, the Pearson’s R value was .69 for the pulse oximeter and the Spree Band. This demonstrates a slight positive correlation; however, the targetted R value is .9 due to community standards. For the statistical analysis, the p value was .427 which is greater than .05. This demonstrates that there is no significant difference between the data of the Spree Band and the gold standard, thus the spree band has correlation to the gold standard. Note:A T-test was used for the inferential statistics because there was only two variable groups: the Gold Standard devices versus the Spree Fitness Band. An ANOVA test was not needed, because it tests the significance of group differences between two or more groups.
Summary/DiscussionThe Spree device could be improved in several ways. One of the problems was the location in which the device was worn. Since the placement was on one's forehead, it made using it uncomfortable and distracting. A possible solution to this issue could be to change its placement to one's arm/ wrist. In terms of comfort, the devices material could be changed for upon sweating, a rubbery material would either slip off one's forehead or stick on it completely. Another problem encountered was the connection of the device to one’s phone. Although the device would connect, the signal would last temporarily, and reconnecting was difficult. A possible solution to this problem would be the addition of a better sensor in order to have a stronger connection to the Bluetooth signal. Lastly, the results displayed would have been more accurate with a numerical value rather than a color scale. This is due to the fact that an individual may be colorblind or one may interpret the intensity of the colors differently; therefore, the results would differ. A possible solution would be to present numerical results instead of a color scheme.
LAB 3B WRITE-UPTarget Population and NeedAbout 240 million (75%) American people suffer from chronic dehydration, and 2/3 of student Athletes who conducts physical activities do not know that they are dehydrated until critical dehydration. The target demographic People and athletes who do not monitor their hydration throughout the day and or during physical training could place them at risk of becoming critically dehydrated during and after intense training or workouts. People and and athletes need a device that will monitior their hydration levels and notify when they are dehydrated or at risk of dehydration.
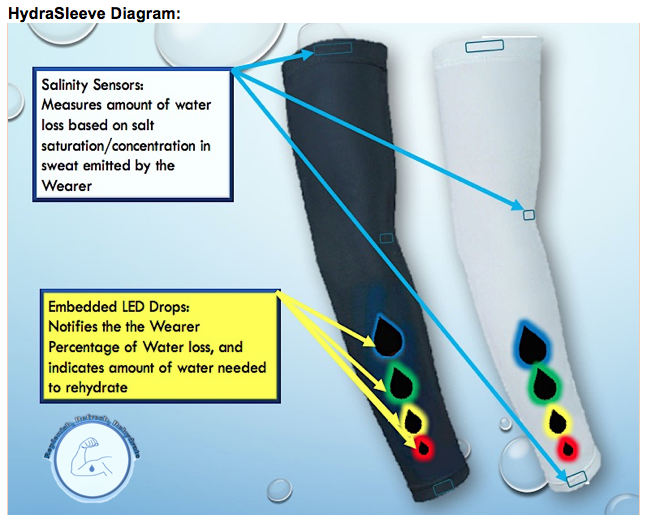
Device DesignMany individuals do not realize they are dehydrated; therefore, the device monitors the percentage of dehydration and the amount of water that needs to be ingested to prevent dehydration. People and athletes need a device that will simply show the hydration levels, indicating when they need to rehydrate to avoid dehydration. The key feature of the device is that it needs to be simple and worn by the user, so that it does not get in the way or becomes a hassle during physical activity or training.
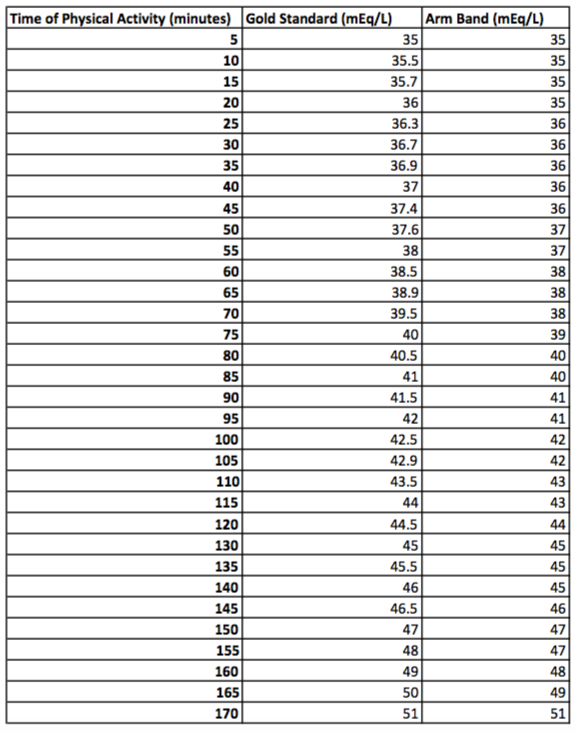
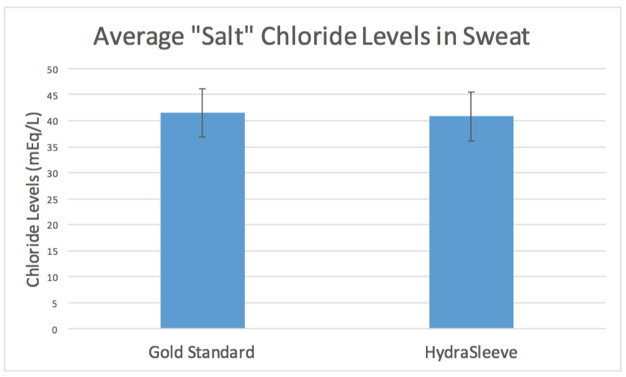
Data/Results/StatisticsData SetThe data set is the averages of chloride ion levels of two seperate groups the Gold Standard group and the HydraSleeve (Arm Band) group during physical activity over time.
Inferential Statistics
Graph
Logo |
|||||||||||||||||||||||||||||||

