BME100 s2016:Group14 W1030AM L2
| Home People Lab Write-Up 1 | Lab Write-Up 2 | Lab Write-Up 3 Lab Write-Up 4 | Lab Write-Up 5 | Lab Write-Up 6 Course Logistics For Instructors Photos Wiki Editing Help | |||||||
|
OUR TEAM
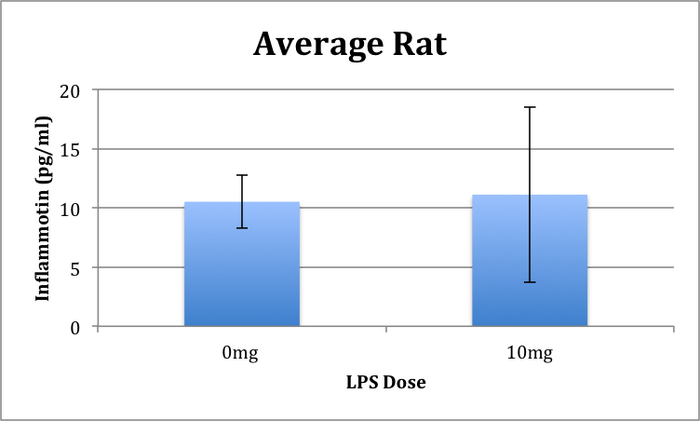
LAB 2 WRITE-UPDescriptive StatisticsExperiment 1 Rat Study: 0 mg: Average- 10.516 Standard Deviation- 2.22555 Endpoint- 5 Standard Error- .99529 10 mg: Average- 11.112 Standard Deviation- 7.40289 Endpoint- 5 Standard Error- 3.31067
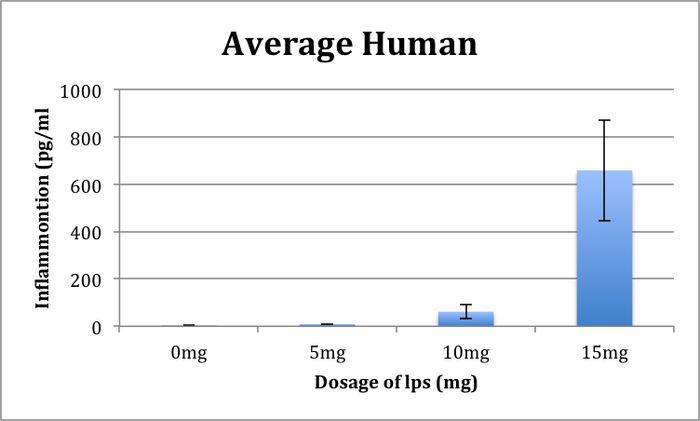
Experiment 2 Human Study: 0 mg: Average- 3.834 Standard Deviation- 1.52301 Endpoint- 10 Standard Error- 0.48162 5 mg: Average- 8.932 Standard Deviation- 1.59393 Endpoint- 10 Standard Error- .50405 10 mg: Average- 61.622 Standard Deviation- 30.1107 Endpoint- 10 Standard Error- 9.52184 15 mg: Average- 657.941 Standard Deviation- 212.943 Endpoint- 10 Standard Error- 67.3385
ResultsFigure 1.1 The trial data for the rat trials were shown above in two columns for the two samples, one being 0mg and the other being 10mg. Figure 1.2 In this graph, the results for the human trials were posted, for all four different dosages, the 0mg, 5mg, 10mg and 15mg.
AnalysisExperiment 1 The rat trials conducted was done in a sample size of 10, being split up into two groups, a group who took 0mg of the dosage and a group that took 10mg of the dosage. The average of inflammation for the rats that took the 0mg dosage was 10.516 and the average for the rats that took the 10mg dosage was 11.112. The standard deviation found for the group who took 0mg was 2.22555 and for the group who took 10mg was 7.40289. When this data was graphed, a ANOVA was ran to figure the p-value of .867403 showing that this data was not statistically significant. The standard error for the rat trial for 0mg was .99529 and for the 10mg group it was 3.31067. For the T-Test result in the rat study, (0mg,10mg) the T-test value was .867403, it was a two-pared test. The t critical value was 2.306004. It is not significant because the t-test value does not follow the .05 rule. With the Pearson test, the value was -.57516.
For the Human trials, there were 40 volunteers.For measuring the data, there needed to be a separation among the different dosage amounts. For the average of inflammation in humans for 0mg was 3.834, for 5mg it was 8.932, for 10mg it was 61.622, and for 15mg it was 657.941. With these averages, a standard deviation was calculated for each which for 0mg it was 1.52301. 5mg it was 1.59393, for 10mg it was 30.1107 and for the 15mg sample it was 212.943. Once this data was graphed, a ANOVA was ran to find that the p-value was 1.4*10^-16 which means that the data was statistically significant. The standard error for the human trials was as followed: 0mg was .48162, 5mg was .50405, for 10mg it was 9.52184 and for 15mg it was 67.3385. In the t-test the two of the dosages where compared to each other to find the t-value and the corrected p-value. 0mg vs. 5mg- The T-test value was 8.6*10^-7, it was a two-pared test. The t critical value was 2.100922. It is significant. 0mg vs. 10mg- The T-test value was 1*10^-5, it was a two-pared test. The t critical value was 2.100922. It is significant. 0mg vs. 15mg- The T-test value was 1.39*10^-8, it was a two-pared test. The t critical value was 2.100922. The value will be considered significant because it is less than .05. 5mg vs. 10mg- The T-test value was 3.04*10^-5, it was a two-pared test. The t critical value was 2.100922. The value was less than .05,therefore, it is significant. 5mg vs. 15mg- The T-test value was 1.57*10^-8, it was a two-pared test. The t critical value was 2.100922. That means it is significant. 10mg vs. 15mg- The T-test value was 6.48*10^-8, it was a two-pared test. The t critical value was 2.100922. It is significant because it has t-test value of less than .05. The Pearson test values for 0mg vs 5mg was -.02763, 0mg vs 10mg was -.05914, 0mg vs 15mg was .304791, 5mg vs 10mg was .354656, 5mg vs 15mg was .160473, and lastly 10mg vs 15 mg was -.55242.
Summary/DiscussionComparing the graphs side by side, one can see that they both show that there is a difference in inflammation between the dosage consumers and the non-dosage consumers. This being true for the rat trials because one can see there is not a significant difference between the sample that took 10mg of the dosage versus the sample that ingested none of the dosage. In the human trial graph, one can visually see on the graph that there is a significant difference between each of the different dosage samples. Even though the y-value of the graph is roughly 50 times larger than the maximum y-value of the rat trial graph, with the ANOVA test being ran, the numbers show that there is a highly statistically significance between the dosage samples. The difference is high between the rat and human trials but also high within the human samples themselves. This shows that the higher the dosage, the more effect it has on the inflammation levels among the human population. |
|||||||


