BME100 s2016:Group12 W1030AM L2
| Home People Lab Write-Up 1 | Lab Write-Up 2 | Lab Write-Up 3 Lab Write-Up 4 | Lab Write-Up 5 | Lab Write-Up 6 Course Logistics For Instructors Photos Wiki Editing Help | |||||||||||||||||||||||||||||||||||||||
|
OUR TEAM
LAB 2 WRITE-UPPreliminary Lab Description The following data is from two experiments that were conducted. The first experiment used forty elderly humans at a retirement center broken into four sets of ten. One set was given a placebo dosage of LPS, and the others were given 5mg, 10mg, and 15mg respectively. Following the administration of the LPS, that patients had their inflammotin levels measured in order to see the effect that LPS had on them. The second experiment used ten rats as subjects. Five of the rats were given a 10mg dosage of LPS and the other five were given a placebo dosage. Like the first experiment, this was done in order to determine the effect that LPS had on the levels of inflammotin. Descriptive Statistics
ResultsExperiment 1 The following graph is data obtained from forty elderly human test subjects.
The following graph is data obtained from ten rat test subjects.
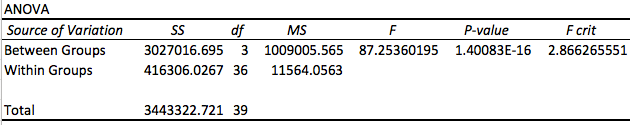
AnalysisExperiment 1 This experiment consisted of four data sets corresponding to four different dosages. The ANOVA Test was used because it allowed the analysis of differences that exist among several groups. The table below shows the results obtained from performing the ANOVA Test.
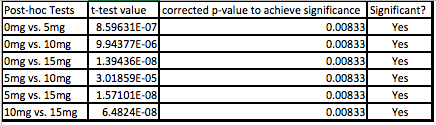
The following table shows the post-hoc test performed. T-tests were also performed to include comparisons between all of the groups. For example, the 5mg test group was compared with the 0mg, 10mg, and 15mg groups one at a time. This process was repeated with 0mg, 10mg, and 15mg until all had been compared one-on-one with each and every group. The t-test values, when comparing each data test, reflected much lower values than the corrected p-value. This meant that there was a statistical significant difference between the groups.
Therefore, on the Experiment 1 graph seen above, the horizontal line and asterisk over the bars indicate these statistically significant differences. For added clarity: the comparisons between the 0mg and 5mg test groups, the 0mg and 10mg test groups, the 0mg and 15mg test groups, the 5mg and 10mg test groups, the 5 and 10mg test groups, and the 10mg and 15mg test groups all proved that the differences were statistically significant.
This experiment analyzed the effect of different LPS dosages on inflammotin levels, and it only had two data sets corresponding to two different dosages. A t-test was used to allow the analysis of differences amongst both groups. The t-test was selected by choosing the t.test(array1, array2, 2, 2) option. This option was selected because the data groups were unpaired samples consisting of two different groups. The calculated p-value was 0.867403497 which is significantly larger than .05, meaning that there is no statistical difference among the groups.
Summary/DiscussionTo summarize the data from both experiments, comparisons amongst dosage groups in Experiment 1 showed their differences to be statistically significant, whereas the comparison between the two dosage groups in Experiment 2 showed their differences to be statistically insignificant. In other words, the effect of LPS on inflammotin levels was shown to have a significant and direct correlation in humans. As the dosage of LPS increased, the level of inflammotin also increased and exponentially so. When it came to the effect of LPS on inflammotin levels in rats, the difference between the placebo group and the experimental group was insignificant, and so there was no measurable significant correlation. Comparing Experiment 1 and Experiment 2 together, there was a placebo group and a 10mg dosage group in each, and so to the casual observer, it might have been suspected that the results would have turned out similarly. This was not the case however, and the potential reasons behind this are possibly numerous. For example, the differences between rat and human biochemistry and the fact that there were only ten test subjects in one experiment versus forty in the other might have been contributing factors. The list goes on and on.
|
|||||||||||||||||||||||||||||||||||||||