BME100 s2016:Group11 W1030AM L6
| Home People Lab Write-Up 1 | Lab Write-Up 2 | Lab Write-Up 3 Lab Write-Up 4 | Lab Write-Up 5 | Lab Write-Up 6 Course Logistics For Instructors Photos Wiki Editing Help | |||||||
OUR COMPANY
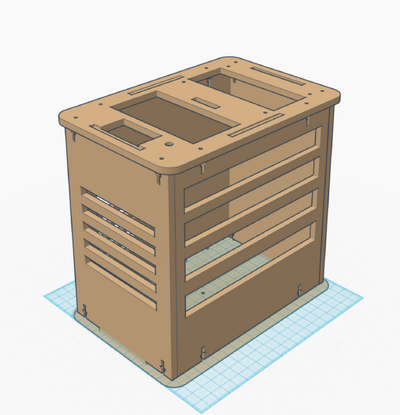
LAB 6 WRITE-UPBayesian StatisticsOverview of the Original Diagnosis System 16 groups of 6 students each tested 2 different patients, so 32 total patients were tested. While someone was preparing the imageJ analysis program the other students were preparing the camera and the flourimeter to take the pictures. Someone else was preparing the solutions of the samples, DNA and SYBR green solution. The team then worked together to place a drop of the solution in the correct manner on the slides that were placed in the fluorimeter. For each patient three samples were taken and tested in order to prevent error. The ImageJ analysis was calibrated using two control samples. One sample was a positive control and the other was a negative control. For every sample there were three pictures taken and analyzed. The lab’s results showed that calculation 1 had a probability of 83%. Calculation 2 had a probability of 83%, calculation 3 had 38% and calculation 4 had 114%. What Bayes Statistics Imply about This Diagnostic Approach The first calculation showed the probability of a patient getting a positive test conclusion when they have a positive PCR reaction, and calculation 2 was the probability of getting a negative test conclusion with a negative PCR reaction. Since the probability was close to 100% it shows that PCR tests were quite reliable. The third calculation gave the probability of developing the disease when given a positive test conclusion and the fourth calculation was the probability of not developing the disease with a negative test conclusion. The third calculation was below 50% showing that this test was quite unreliable for effectively diagnosing the disease. The fourth calculation was over 100%, this occurred because the doctor diagnosed fewer people without the disease then the PCR test did. This also shows the test was unreliable. It would lead some people to believe they didn’t have the disease when they in fact did. There were a few sources of error that may have influenced the end results. First the imageJ program has limits to how accurately it can measure the light in the images. While the lab teams were taking each of the images the setup had to be moved and replaced on the fluorimeter. Inconsistencies in the where the slide was placed can cause an error in the measurements. The measurements are also dependent on correctly getting the sample, PCR solution, and SYBR green solution. The person handling the pipettor could have easily gotten too little of any of those solutions in the drop. Intro to Computer-Aided DesignTinkerCAD The TinkerCAD tool was used during the Computer-Aided Design lab to design a PCR machine. The first thing that was done to design this PCR machine was that the pre-prepared body of the machine was uploaded onto TinkerCAD using a tool that could be import designs. The next thing that was done was that the parts had to be rotated and adjusted in order to fit the frame of the PCR machine that was on TinkerCAD. When it was time to design the heating chamber, the part was simply uploaded onto TinkerCAD and then copied multiple times in order to quickly allow for a total of four to be present within the machine. They were then moved together in order to make one larger piece and then a hole was cut into an entire heating chamber. The TinkerCAD tool was proven to be a design software that was not as great as SolidWorks in terms of function, however, it did have some very useful tools that SolidWorks did not. For example, there was a copy and paste function and TinkerCAD that really helped to speed up the process of design, allowing for easy rotation of copied and pasted design parts.
Feature 1: ConsumablesFor our new package plan, we use bigger kit so that we can contain more consumables in one kit, which will help the transportation. Besides, we gonna put plastic tubes(the bottom of the kit) tubes and glass sides(above plastic tubes) together to fully use the extra space.since our PCR machine add cooling system, making cooling phase shorter, we will improve our tube and make it more resistant and stable facing drastic changing temperature. Feature 2: Hardware - PCR Machine & Fluorimeterfor the fluorimeter, one major weakness we found is the relative position of the camera and the fluorimeter will change slightly when changing the glass slides, so we are gonna connect the camera holder and the fluorimeter using a "arm". So the position won't change after you set it up.
| |||||||


