BME100 s2016:Group11 W1030AM L3
| Home People Lab Write-Up 1 | Lab Write-Up 2 | Lab Write-Up 3 Lab Write-Up 4 | Lab Write-Up 5 | Lab Write-Up 6 Course Logistics For Instructors Photos Wiki Editing Help | ||||||||||||||||||||||||||||
OUR TEAM
LAB 3A WRITE-UPDescriptive Statistics
Results
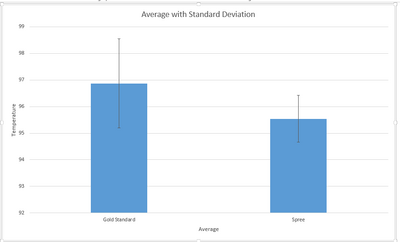
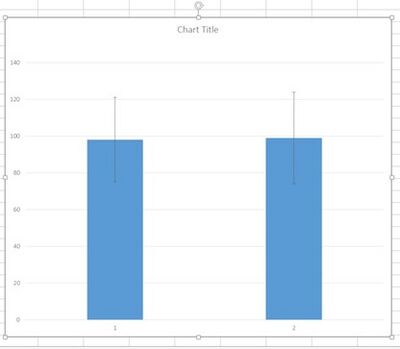
AnalysisFor Temperature T-test = 1.226E-32 T-test < 0.05 There is a statistical difference between the spree headband and the gold standard. The Pearson's r coefficient is 0.208 indicating very little correlation. For heart rate T-test = 0.657460772 T-test > 0.05 There is not a statistical difference between the spree headband and the gold standard. The Pearson's r coefficient is 0.69 indicating they have positive correlation.
Summary/DiscussionWe are at least 95% confident that there is a significant difference between the spree headband and the thermometer, the t-test value was 1.226E-32 with an alpha of 0.05. However, there was diminutive correlation between the spree headband and the thermometer according to the Pearson’s r coefficient of 0.208. Furthermore, there was no significant difference between the spree headband and the pulse oximeter. The spree headband displays temperature as a color that corresponds to a range of temperatures, this leads to less accurate temperature readings and misinformation to the customer. An improvement on this technology would be to give number values for temperature instead of a range; this change would be more accurate and the customer would be more informed.
LAB 3B WRITE-UPTarget Population and NeedOur target population is wearable fitness device users and athletes. The main demographics includes people 18 to 34 both male and female. "Nearly one-third of US smartphone users, or roughly 46 million people, accessed fitness related apps in January of 2014. This usage grew by 18% year over year." http://www.wearables.com/who-are-fitness-wearables-users/#sthash.lZ9mPKLz.dpuf Many sports teams are using wearable fitness devices to track their performance and then sending the data to their coaches, trainers, and players for analysis. "Biometric sensors and GPS trackers developer Catapult Sports is currently working with 515 teams around the world ...... The NBA said in February it is testing out the technology in its D-League, making it the first U.S. professional sports league to use performance analytic devices in a game." http://www.biometricupdate.com/201410/professional-sports-teams-and-athletes-driving-wearable-technology
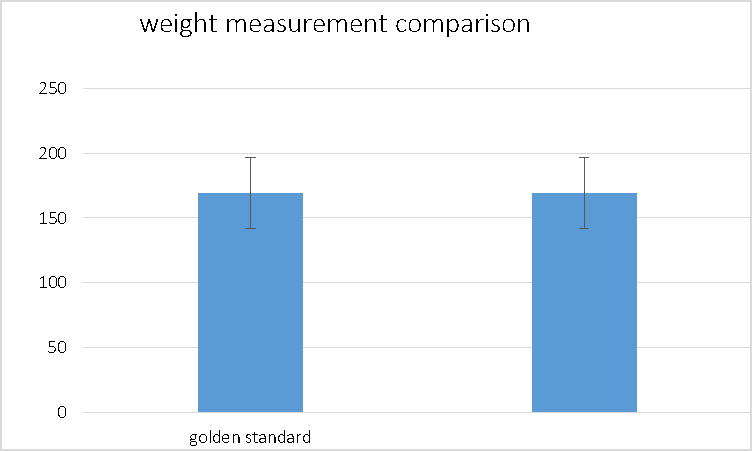
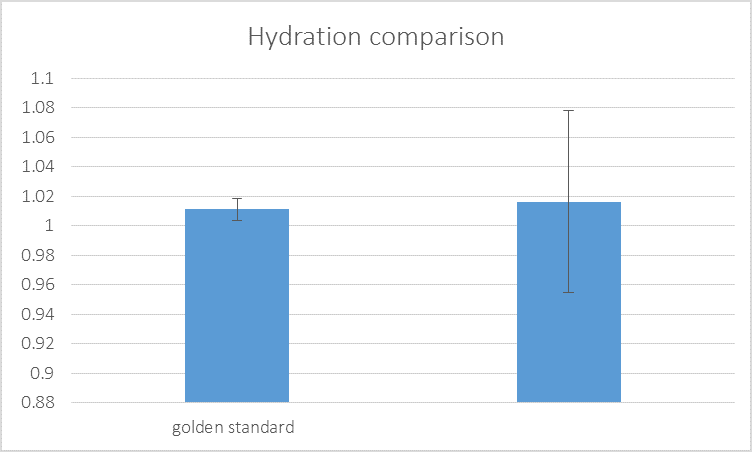
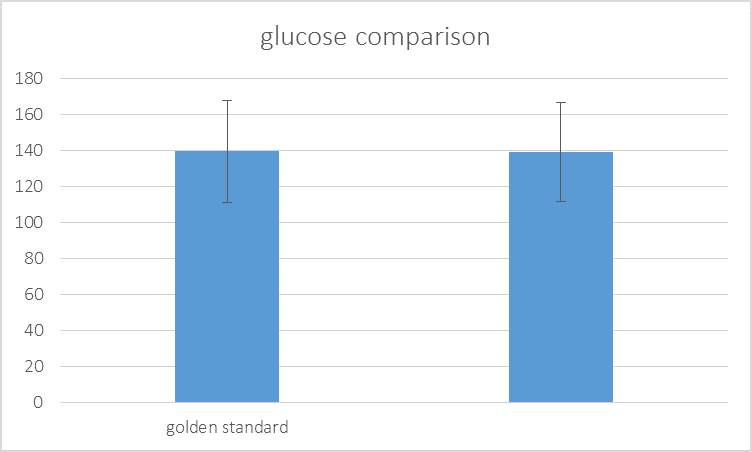
Device DesignInferential Statistics{ Blood Glucose Levels Blood Glucose Levels PEOPLE TESTED Gold Standard (Glucometer) Sole Tech (Sweat Glucose) Person 1 176 173 Person 2 106 108 Person 3 160 159 Person 4 93 92 Person 5 172 170 Person 6 104 105 Person 7 95 96 Person 8 153 153 Person 9 108 110 Person 10 178 174 Person 11 139 138 Person 12 150 153 Person 13 101 100 Person 14 107 109 Person 15 161 159 Person 16 142 140 Person 17 139 138 Person 18 116 118 Person 19 160 161 Person 20 165 163 Person 21 144 143 Person 22 160 162 Person 23 119 120 Person 24 174 175 Person 25 166 163 } {1.002 - 1.030 indicates Hydration Level 2% Body Weight Loss is Dehydration PEOPLE TESTED Gold Standard (Urinalysis Specific Gravity) Sole Tech (Body Weight % Loss) Person 1 1.015 1 Person 2 1.004 0.1 Person 3 1.011 0.8 Person 4 1.012 0.8 Person 5 1.007 0.3 Person 6 1.003 0 Person 7 1.011 0.8 Person 8 1.017 1.1 Person 9 1.006 0.2 Person 10 1.019 0.13 Person 11 1.005 0.2 Person 12 1.012 0.8 Person 13 1.004 0.1 Person 14 1.021 0.14 Person 15 1.018 0.13 Person 16 1.003 0
Person 18 1.003 0 Person 19 1.027 1.9 Person 20 1.006 0.2 Person 21 1.007 0.3 Person 22 1.015 1 Person 23 1.028 2 Person 24 1.003 0 Person 25 1.005 0.2 } subject # weight w/ scale (lbs) weight w/ sole tech 1 130 129 2 172 169 3 125 126 4 200 202 5 178 178 6 135 135 7 210 211 8 153 153 9 160 159 10 164 164 11 145 143 12 185 185 14 215 216 15 178 178 16 156 158 17 144 146 18 220 221 19 154 156 20 131 132 21 185 184 22 196 196 23 169 167 24 160 161 25 188 187
Graph
|
||||||||||||||||||||||||||||

