BME100 s2015:Group9 12pmL5
| Home People Lab Write-Up 1 | Lab Write-Up 2 | Lab Write-Up 3 Lab Write-Up 4 | Lab Write-Up 5 | Lab Write-Up 6 Course Logistics For Instructors Photos Wiki Editing Help | ||||||||||||||||||||||||||||||||||
|
OUR TEAM
LAB 5 WRITE-UPProcedureSmart Phone Camera Settings
Placing Samples onto the Fluorimeter
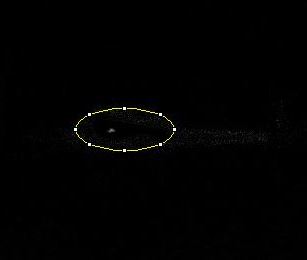
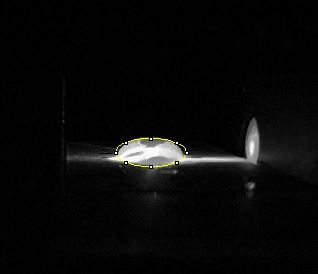
Data AnalysisRepresentative Images of Negative and Positive Samples Negative Control Image Positive Control Image
Observed results
water. In the gray scale, it is represented as a light gray droplet where image didn't change in display.
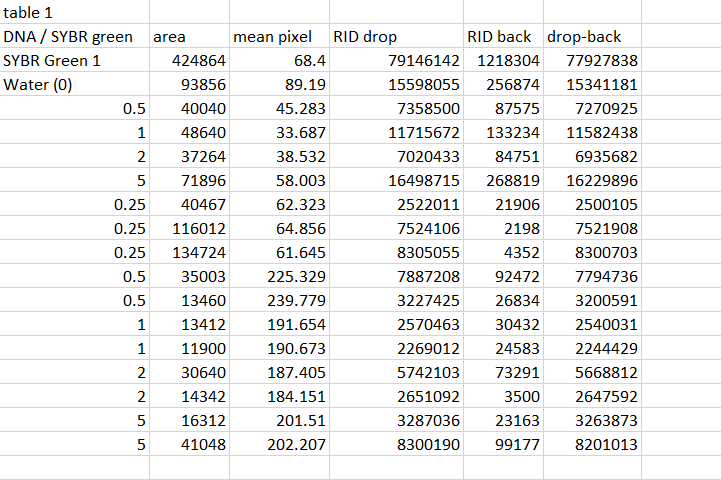
Patient 1 DNA was split up into three samples of varying concentrations where they were close to the negative control concentration. When the three droplets concluded in concentrations way below the positive control meaning that there was no diseased primer present in the droplet even with the mixture of 80 μL of SYBR Green 1. With the fluorescence test where it lit up as a dark blue as the fluorimeter's light was refracted among the primers resulting in perfect matches of the divided DNA during PCR. This mixture of DNA and SYBR Green undergoes PCR where human DNA is denatured and a healthy primer then binds to it during annealing process since the base nucleotides match each other and anneal together as base pairs. With this visual presentation is accurate to the quantitative data calculated in which patient #52130 has a nice amount of DNA by 80μL and that it didn't glow the green dye from SYBR which is an indicator of a diseased primer duplicated during PCR.Patient 52130 resulted in not having a diseased primer
Patient 2 DNA was split up into three samples of varying concentrations where they were close to the negative control concentration. When the three droplets concluded in concentrations way below the positive control meaning that there was no diseased primer present in the droplet even with the mixture of 80 μL of SYBR Green 1. With respect to the same occurring result from Patient 1, the fluorescence test where it lit up as a dark blue as the fluorimeter's light was refracted among the primers resulting in perfect matches of the divided DNA during PCR. This mixture of DNA and SYBR Green undergoes PCR where human DNA is denatured and a healthy primer then binds to it during annealing process since the base nucleotides match each other and anneal together as base pairs. With this visual presentation is accurate to the quantitative data calculated in which patient #52130 has a nice amount of DNA by 80μL and that it didn't glow the green dye from SYBR which is an indicator of a diseased primer duplicated during PCR. Patient 17921 does not carry a diseased primer at all.
SNP Information & Primer DesignBackground: About the Disease SNP First there is SNP which stands for "Single nucleotide polymorphism". A nucleotide is a molecule or molecules which link together to form the building blocks of DNA & RNA. Then Polymorphism is the presence of 2 or more distinct phenotypes in a population due to the expression of different alleles of a given gene, as human blood groups O, A, B & AB. In SNP with a generic variation of rs 268, found in Homo Sapiens and has a chromosome variation mapped on Chromosome:8: 19956018. The clinical significance of this particular SNP is that it's Pathogenic and is associated as Lipoprotein Lipase or LPL and is also linked to SNP as a CHD disease. The disease CHD also known as coronary heart disease is a common heart disease in which is the number one cause of deaths in the United States. The disease starts with having a waxy substance known as plaque building up in the coronary arteries. Nevertheless, Lipoprotien Lipase is a specific sequence of SNP that has specific functions like apolipoprotein binding, heparin binding and lipoprotein lipase activity. An allele is a one of a # of alternative forms of the same gene through mutation on the chromosome that carries the genetic information passed on from parents. The disease-associated allele is classified with nucleotides as AGT. Within SNP, it is located in the numerical position as number 19956018 and then the reverse primer is located at the numerical position of 19956218. Primer Design and Testing The primer test was successful in receiving clear matches for both the forward and reverse primers when they would go through the PCR experiment and is in respect to working in a solution of 50 mM salt and 50 nM annealing oligo concentration. In the human genome there would be no matches with the diseased primer having a mutation of AGT which doesn't exist in the DNA. Since the human genome is unique with all of its characteristics, it is also at risk of obtaining coronary heart disease with a slight variation in the alleles or nucleotide build-up. The non-diseased primer would appear with results because there is no variations of the DNA and will have the AAT nucleotide instead and ended up in passing the primer test with matches.
| ||||||||||||||||||||||||||||||||||
