Type of Smartphone: Samsung Galaxy S4 (Model Number: SCH-I545)
Flash: No flash used
ISO setting: Automatic
White Balance: Automatic
Exposure value: 0 (Normal)
Saturation: Normal
Contrast: Normal
Calibration
For this experiment, the phone was placed in the cradle vertically, and secured to ensure that the phone did not move at all while taking the pictures throughout the duration of the experiment. Before taking each picture, a lab group member manually focused the camera on the drop itself to obtain the clearest picture possible. A lab group member also took care to make sure that the distance between the smart phone cradle and drop remained constant throughout the experiment, and verified that that flourimeter could be easily placed over the system. Once the lid was closed, three pictures were taken in succession using a timer so multiple trials could be recorded.
Distance between the smart phone cradle and drop = 9.4 cm
Solutions Used for Calibration
Initial Concentration of 2X Calf Thymus DNA solution (micrograms/mL)
Volume of the 2X DNA solution (µL)
Volume of the SYBR GREEN I Dye solution (µL)
Final DNA concentration in SYBR Green I solution (µg/mL)
5
80*
80*
2.5
2
80*
80*
1
1
80*
80*
0.5
0.5
80*
80*
0.25
0.25
80*
80*
0.125
0
80*
80*
0
Placing Samples onto the Fluorimeter
Verify that the blue light of the flourimeter is shining in between the first two rows of vacuoles
Set the volume of the micropipette to 80 microliters
Place the micropipette into the SYBR green bio-indicator solution and withdraw 80 microliters into the micropipette
Place the 80 microliters of SYBR green bio-indicator solution in between the first two rows of vacuoles, taking care to ensure that the light is shining through the center of the drop
Eject safety tip into a disposal receptacle (in the case of this lab, a plastic cup
After placing another safety tip on the micropipette, obtain 80 microliters of the PCR/buffer solution
Place sample PCR/buffer solution directly on top of the SYBR green fluid
Close the lid of the flourimeter to ensure that no extraneous light is entering the system
Take multiple pictures (3) of the drop using the timer
Repeat process for the remainder of the samples
Observe, record, and analyze results
Data Analysis
Representative Images of Negative and Positive Samples
Positive Sample
Negative Sample
Image J Values for All Calibrator Samples
NOTE: The lab group did not have sufficient time to complete three trials of each sample on ImageJ. Instead, two trials were completed.
Calibration curve
PCR Results Summary
Our positive control PCR result was 2.38 μg/mL
Our negative control PCR result was -1.49 μg/mL
The negative value observed in the negative control PCR result originated from the graph found below
Observed results
Patient 74239 : Drop contained a noticeable amount of green fluorescence, observed concentration 6.93 μg/mL (1-3)
Patient 82959 : Drop DID NOT contain any noticeable amount of green fluorescence, observed concentration -1.59 μg/mL (2-2)
Conclusions
Patient 74239 : Positive; In addition to a qualitative comparison of the patient's images to the positive control, the respective values of micrograms per milliliter are close enough for the conclusion to be drawn that the targeted sequence exists in this patient.
Patient 82959 : Negative; In addition to a qualitative comparison of the patient's images to the negative control, the respective values of micrograms per milliliter are close enough for the conclusion to be drawn that the targeted sequence did not exist in this patient.
SNP Information & Primer Design
Background: About the Disease SNP
SNPs, or single nucleotide polymorphisms, is the most common genetic variation in the human population. It is essentially responsible for the differences in humans' phenotypes (appearances). The actual term refers to a difference in a single DNA nucleotide in a string of DNA (an Adenine nucleotide replaced with e Guanine nucleotide). There are approximately 10 million SNPs that are observed in the human genome. One of the paramount characteristics of these genetic variations is that often a specific variation can result in the formation of a specific disease, such as Alzheimer's. By using methods such as PCR, whereby a specific sequence of DNA is targeted and replicated, the use of a simple bio-indicator can determine whether the specific genetic mutation exists that would cause a specific disease. Therefore, SNPs are a highly relevant concept in the process of diagnosing diseases caused by genetic mutation. In addition, SNPs can help researchers find how different individuals response to a certain set of drugs, and identify their susceptibility to certain diseases and environmental toxins.
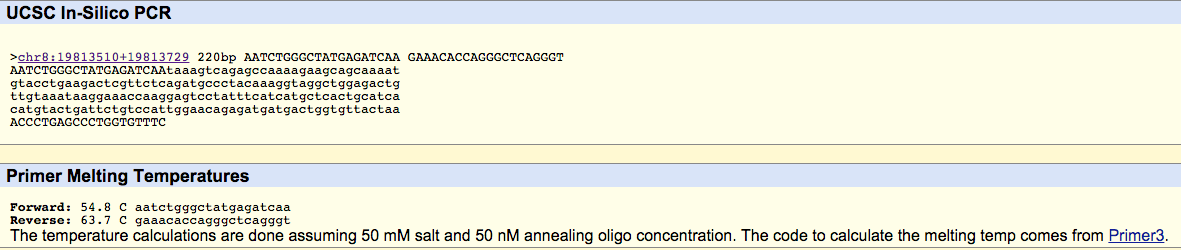
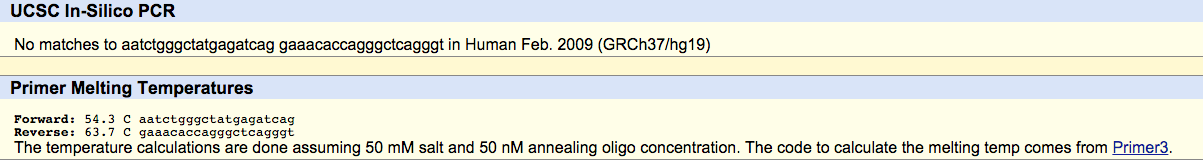
Primer Design and Testing
We found that the non-disease DNA code had a match on the 220bp chromosome 8. We believe this was the result because there was no mutation to the DNA code; as a result, it was exactly the same. However, for the disease DNA code it resulted in no match due to the mutation that was caused by the mutation from A to G.