BME100 s2015:Group8 9amL3
|-
|style="background-color: #EEE"|![]() BME 100 Spring 2015
|style="background-color: #F2F2F2" | Home
BME 100 Spring 2015
|style="background-color: #F2F2F2" | Home
People
Lab Write-Up 1 | Lab Write-Up 2 | Lab Write-Up 3
Lab Write-Up 4 | Lab Write-Up 5 | Lab Write-Up 6
Course Logistics For Instructors
Photos
Wiki Editing Help
|-
| style="background-color: #ffcc66; padding: 5px;" colspan="2" | ![]() |-
| colspan="2"|
|-
| colspan="2"|
OUR TEAM
 |
 |
 |
 |
 |
 |
LAB 3A WRITE-UP
Descriptive Statistics
Results
Analysis
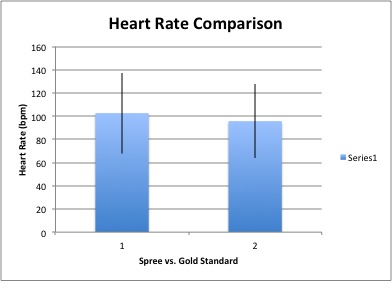
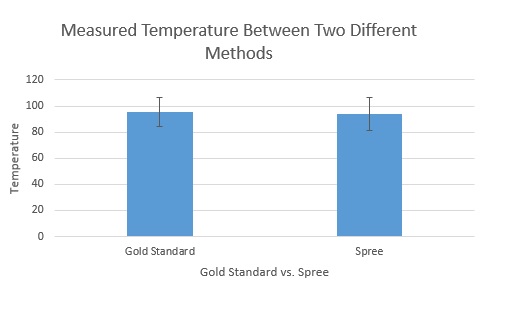
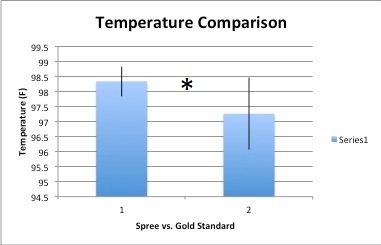
The observed Pearson's R Value for the relationship between the Spree's heart rate monitor and the Gold Standard monitor was 0.83589623, indicating a strong positive correlation between the two sets of values. The P-value for the same relationship was calculated as 0.13637851, far above the necessary threshold of disproving the null hypothesis, making the relationship statistically significant. Alternatively, Pearson's R Value for relationship between the temperature measurements of the two devices was 0.13332247, portraying a considerably weak correlation. Additionally, the P-value for the same relationship was 6.11*10^-13, indicating that there is only an infinitesimally small probability that the null hypothesis, that is that there is no correlation between the temperature readings from the Spree device and that of the thermometer. This was most likely caused by the fact that the Spree device assigned different temperature values to a set of four arbitrary levels. These relationships can be observed in the below graphs: in the "Heart Rate Comparison" graph, the error bars overlap each other almost completely, indicating statistical significance, while those in the "Temperature Comparison" graph only overlap for a comparatively small set of values.
Summary/Discussion
According to the data collected, only the heart rate had a strong correlation with the gold standard, while body temperature did not. These results aren't very good for the Spree company because their product is based on these two product abilities as selling points. There were a few problems with the spree that fall in the appearance and performance categories. The head band is very unappealing to the public, and the performance doesn't make up for it. Although the technology is handy, especially since the data is transferred to your smart phone, it was basically useless in recording body temperature. The temperature "levels" are very primitive, and accurate temperatures cannot be recorded. This is because it is very hard to measure body temperature on the forehead, or at least the technology is not yet there. It may be possible to change the technology in order to be more appealing and be more accurate. For example, if the band was made into a bracelet like other current technology, it would be much more appealing to consumers. Also, if the company could develop a small, reusable patch that could be placed under the arm pit, the Spree would be able to get much more accurate temperature readings.
LAB 3B WRITE-UP
Target Population and Need
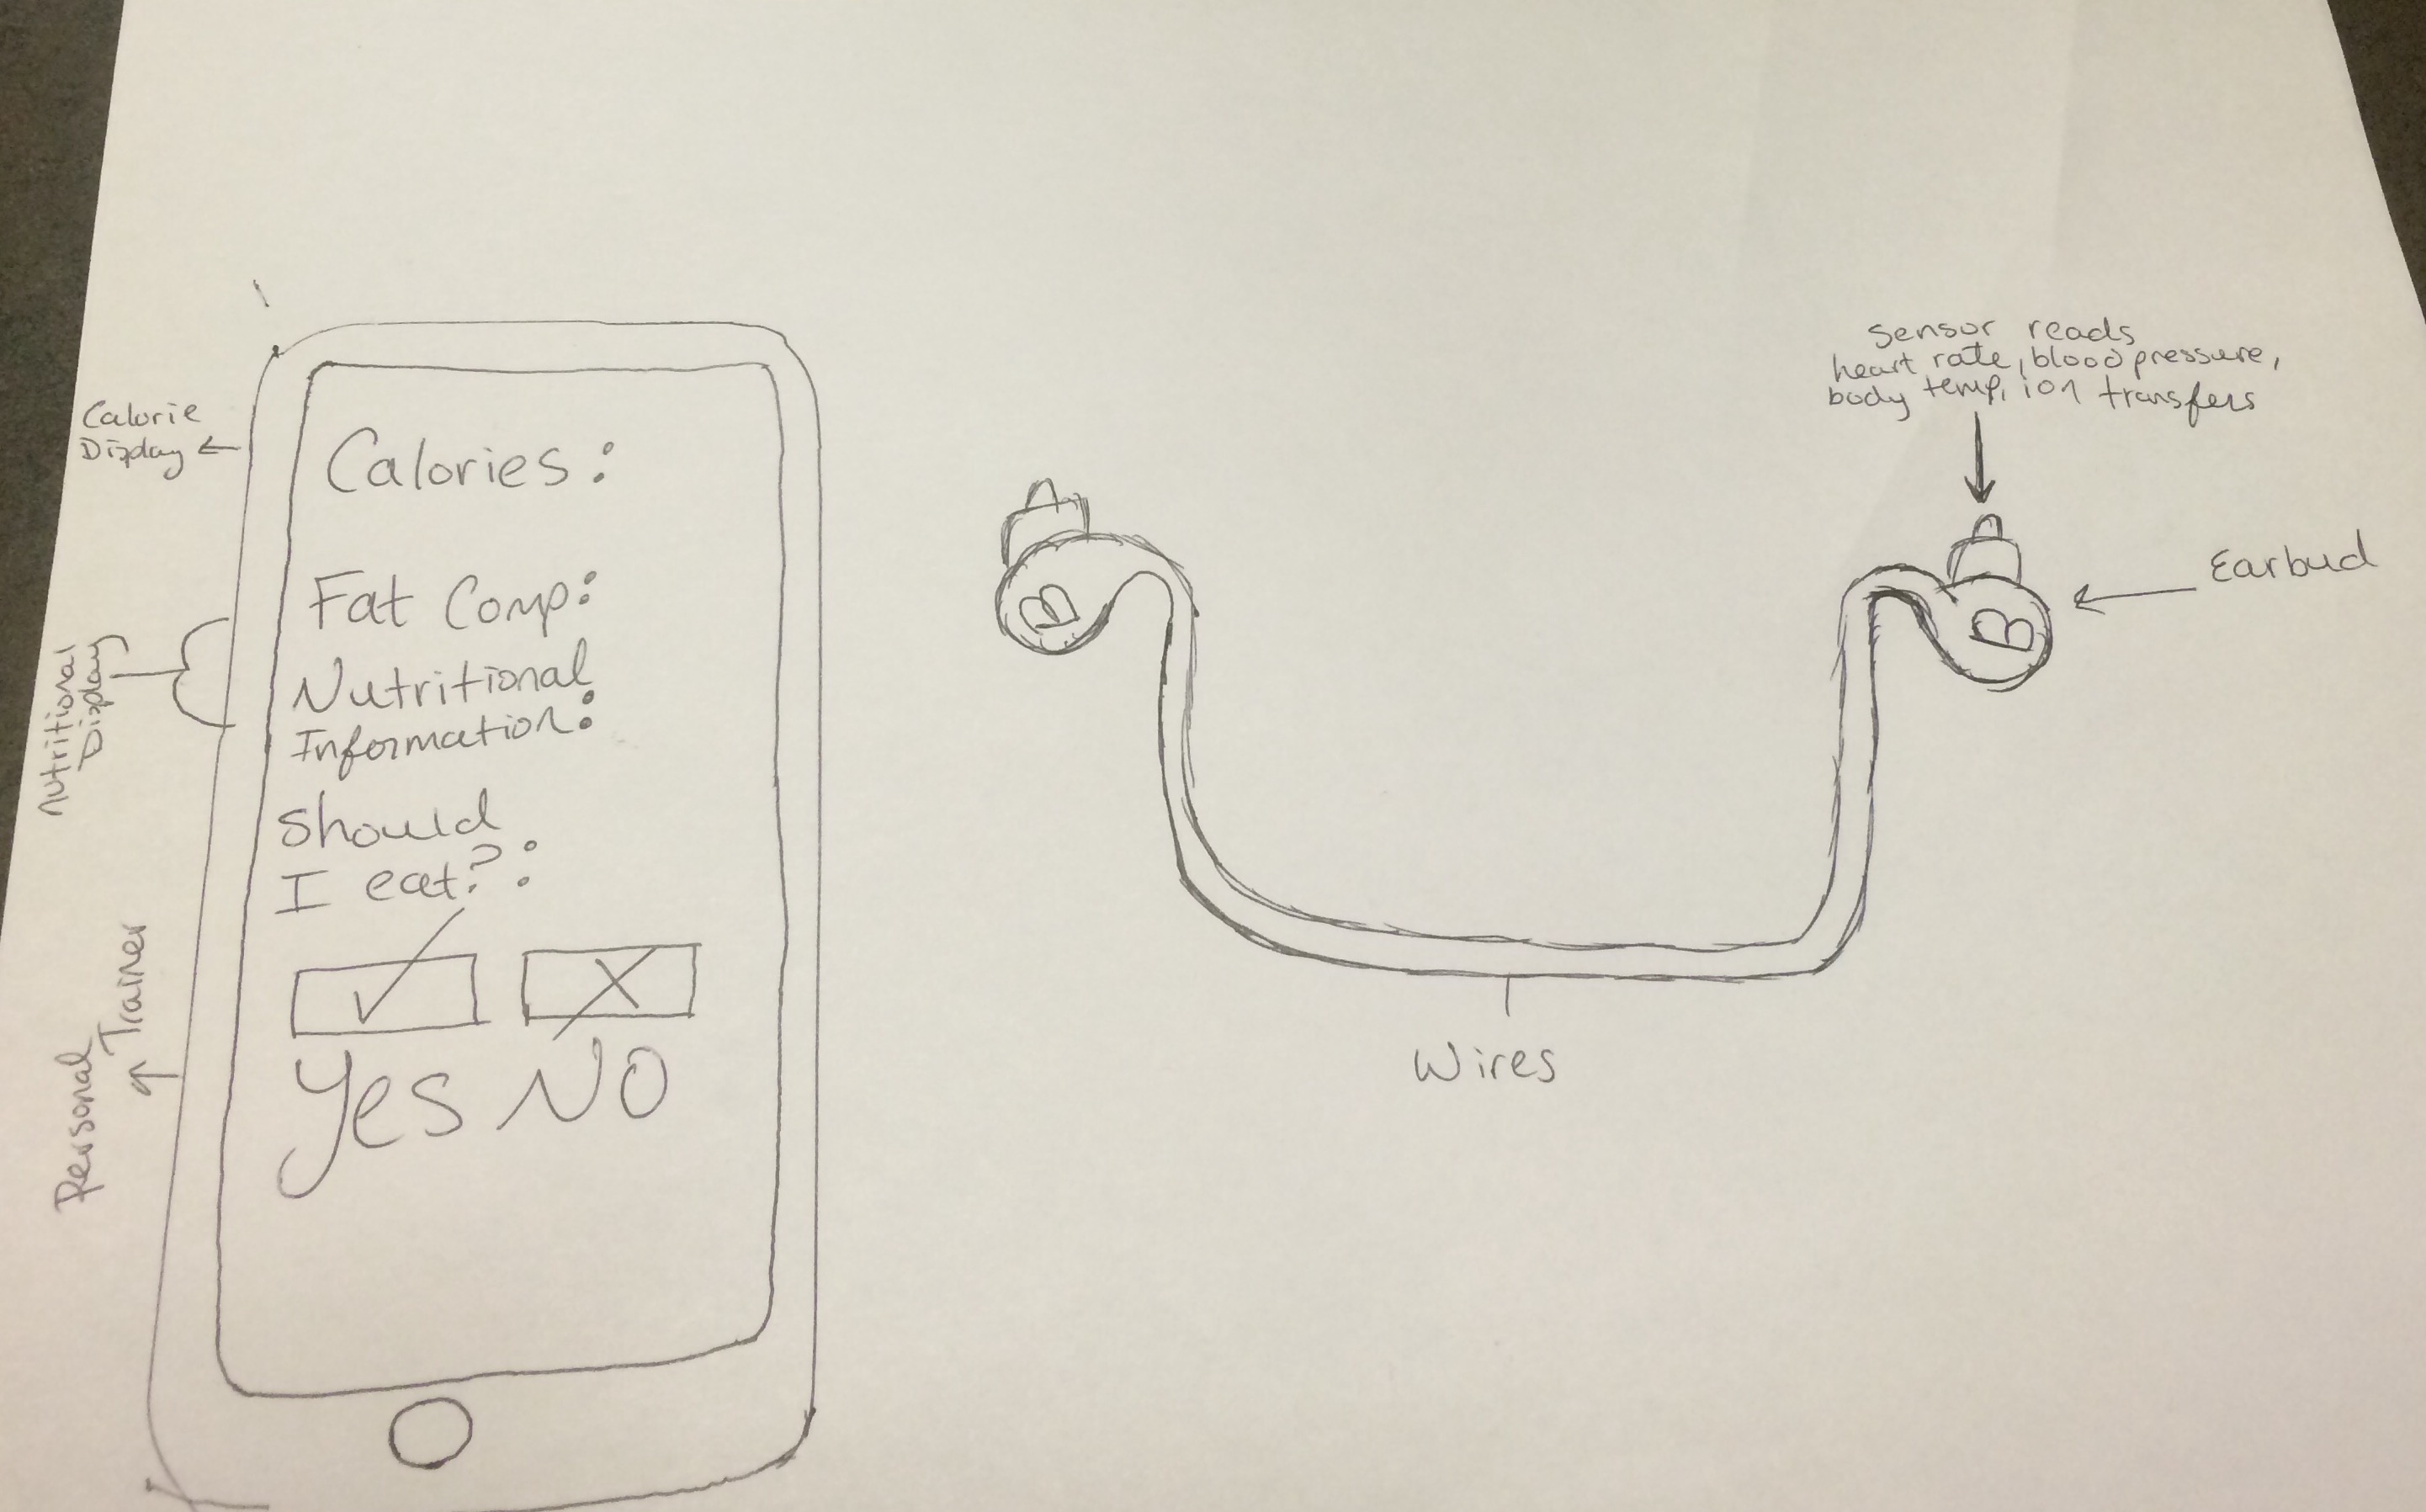
The FitKit is designed for those who are very active and exercise often. There are two parts to the FitKit that are specially made to adapt to the lifestyle of an athlete. The Beets headphones provides the athlete with accurate fitness information including heart-rate, body temperature, pressure, and ion transfers in a person's perspiration while the convenient app has a built-in calorie counter. The need, while not as high as for the average person, is great for athletes. Athletes typically have stricter diets in order maximize their performance, so the calorie-counter is perfect for athletes in training. Also knowing one's ion transfers in the perspriation is a great advantage for athletes.
Device Design

Inferential Statistics
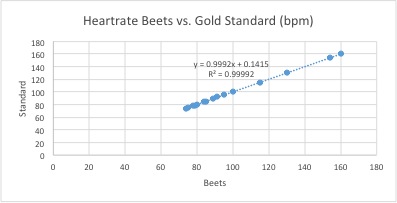
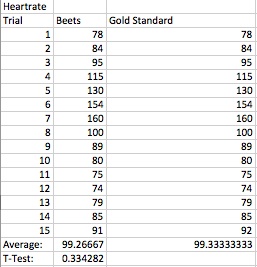
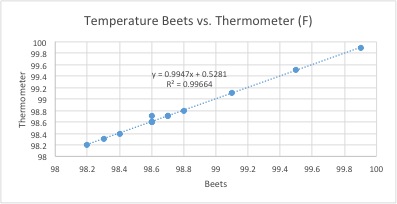
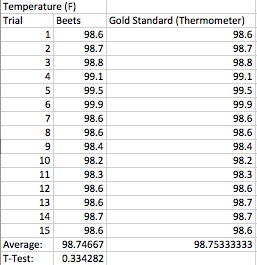
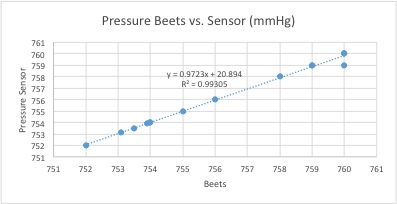
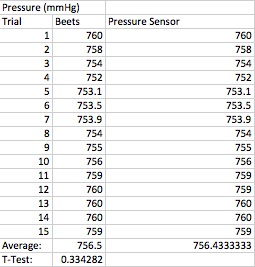
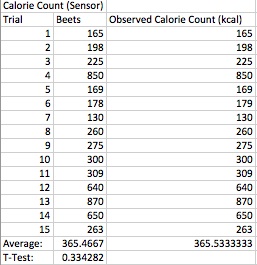
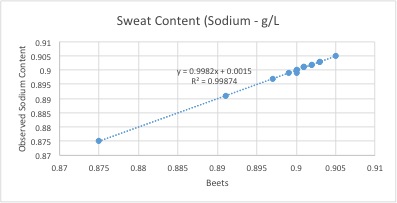
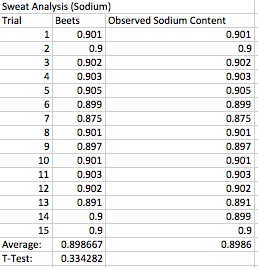
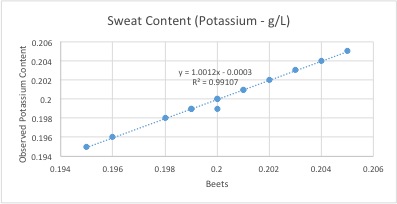
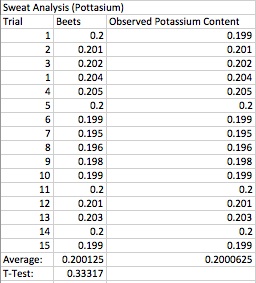
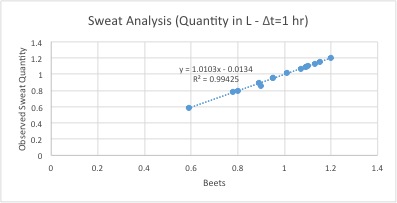
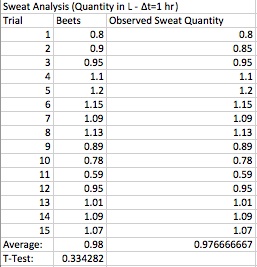
As shown in the series of data tables comparing values obtained from the Beets device and the FitKit monitoring sensor, the T-test P values that were garnered from comparing the averages of the Beets/FitKit hardware with the observed quantities were consistently far below the necessary threshold to determine the relationship’s statistical significance (p ≤ 0.05): every relationship, according to the P values obtained, is statistically significant. For example, the observed p value for the relationship between the temperature measurements taken from the Beets and that taken from the Gold Standard thermometer was 1.80215692075246 * 10-17.
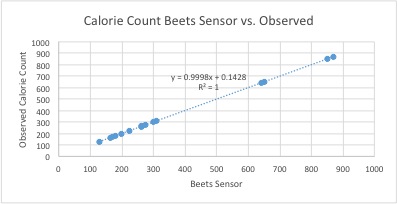
Also observed were exceptionally strong positive correlations between the values, all of them, when analyzed, producing an R2 value of 1. For example, the observed R2 value for the relationship between the temperature measurements taken form the Beets and that taken from the Gold Standard thermometer was 0.996643176641338.
To summarize, not only was the data received very statistically significant, it also experienced a near perfect correlation.
Graph


