BME100 s2015:Group7 12pmL2
| Home People Lab Write-Up 1 | Lab Write-Up 2 | Lab Write-Up 3 Lab Write-Up 4 | Lab Write-Up 5 | Lab Write-Up 6 Course Logistics For Instructors Photos Wiki Editing Help | ||||||||||||||||||||||||||||||||||||||||||||||||||||||||||
OUR TEAM
LAB 2 WRITE-UPDescriptive StatisticsExperiment 1 LPS Dosage (mg) Mean STDev STError
0 3.834 1.52 0.48
5 8.932 1.59 0.50
10 61.62 30.11 9.52
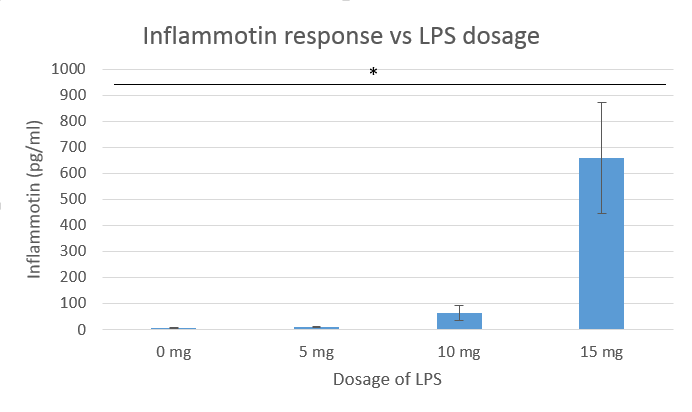
15 657.94 212.93 67.34
Experiment 2 LPS Dosage (mg) Mean STDev STError
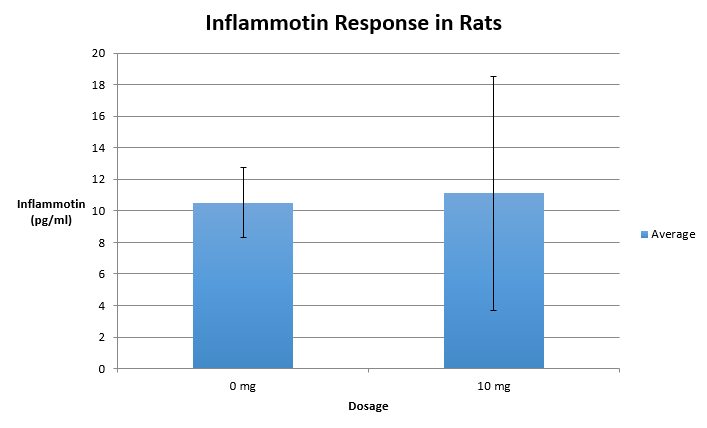
0 10.52 2.23 1.00
10 11.11 7.40 3.31
ResultsExperiment 1 (Human)
GraphingExperiment 1
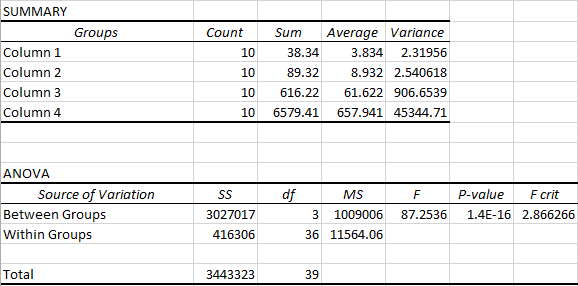
AnalysisExperiment 2 Rats Accepted P-value: p<0.5 No significant difference was shown between the two groups. Summary/DiscussionIn experiment one we see a significant increase in inflammotin production as the dosage of LPS increased. We can argue this by looking at the ANOVA test performed for the human data and seeing that the p-value found showed significant differences between the groups. The ANOVA test was performed because there were more than two groups that needed to be compared. The p-values found by the ANOVA test were significant according to the Bonferroni Correction that required p-values to be less than 0.008333. In the second experiment we see that the rats allow for a more precise and accurate measurement of their inflammotin production levels to be taken. Yet there were only two groups of data, zero and ten milligrams of LPS, to be compared for the rats. The t-test performed on the rat data showed a p-value of 0.867. Since the p-value is above 0.5, this meant that there is no significant difference between the two groups and that increased LPS dosage did not cause increased inflammotin levels for rats. However, it is important to consider that there was only a total of ten rat subjects as opposed to the larger sample size of forty human subjects. In order to increase the variance and possibly see a better change in inflammotin for the rats, more subjects are needed for experimentation. We were able to see a significant increase in inflammotin production levels due to higher LPS dosages only in humans. |
||||||||||||||||||||||||||||||||||||||||||||||||||||||||||


