BME100 s2015:Group6 9amL6
| Home People Lab Write-Up 1 | Lab Write-Up 2 | Lab Write-Up 3 Lab Write-Up 4 | Lab Write-Up 5 | Lab Write-Up 6 Course Logistics For Instructors Photos Wiki Editing Help | |||||||||||||||||||||||||||||||||||||||||||||||||||||||||||||||||||||||
|
OUR COMPANY
LAB 6 WRITE-UPBayesian StatisticsOverview of the Original Diagnosis System During the experiment, we tested two patients by mixing their DNA samples (3 each) with PCR reaction solution (a mix that contains Taq DNA polymerase, MgCl2, and dNTP’s). Then, the mix was left in a PCR machine to denature the DNA samples. After, the samples were tested to measure different concentrations of the DNA by taking pictures of them mixed with SYBR Green 1. Finally, the pictures were analyzed on ImageJ to measure the internal density of the drop compared to the internal density of the background. To determine if the patients has Coronary Artery Disease, their DNA samples were compared to a positive and negative control. The division of labor was 2 patients per group, so with 8 groups there was 16 patients total. To prevent error, each patient had three separate DNA samples to test. Also, in the ImageJ calibration controls there was a fixed area that allowed us to measure the same amount of area per picture. In the ImageJ calibration controls, five controls were used (0.25, 0.5, 1, 2, and 5) and three pictures of each patient were compared to the controls. For class data, there were 13 successful conclusions (8 negatives and 5 positives), 1 inconclusive results, and 2 blank data. What Bayes Statistics Imply about This Diagnostic Approach Calculation 1: What is the probability that a patient will get a positive final test conclusion, given a positive PCR reaction?
Calculation 2:What is the probability that a patient will get a negative final test conclusion, given a negative diagnostic signal?
Calculation 3:What is the probability that a patient will develop the disease, given a positive final test conclusion?
Calculation 4:What is the probability that a patient will not develop the disease, given a negative final test conclusion?
Computer-Aided DesignTinkerCAD
Our Design
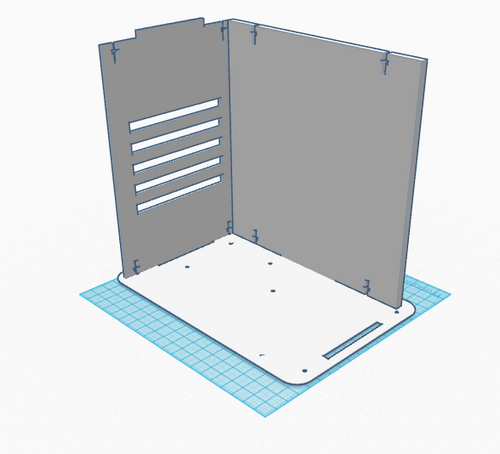
In the new box design, limiting the amount of light exposed to the setup within was the primary objective.The more light that comes into the box, the less accurate the pictures will be, because the light interferes with the dark background inside of the box. The new box design includes the standard bottom and back sides, and an additional side with a window cut into it. The side with the window is meant to be open so that a phone camera can take the pictures necessary for analysis. The standard sides are untouched to prevent any unnecessary light from entering. Ideally, this new design will work better than the old OpenPCR design because more light is blocked out.
Feature 1: Consumables KitWe plan on packing the kit into its compact form for easy shipping and handling. Our kit will include one pair of disposable gloves, 8 tubes of PCR mix 50 milliliters each, 8 empty tubes, micropipettor, 18 disposable micropipettor tips, and a tray to hold the tubes (8 by 3 slots). To package, a row of 8 empty tubes and a row of 8 PCR mix tubes will be placed into the tray. So there will be a row of 8 slots left open. These will be for DNA samples the labs already have. The micropipettor tip will be detached from the base and placed over these 8 open slots. The base of the micropipettor will be placed on top of the rows of empty and PCR mix tubes. Finally, the disposable gloves rolled up and the small bag of micropipettor disposable tips will be placed over the detached micropipettor end. This entire structure will be saran wrapped and an expiration date stamped on the bottom. The kit will be a 2 inch by 4 inch by 4 inch rectangular prism, easy to ship and store at room temperature.
Feature 2: Hardware - PCR Machine & FluorimeterInclude PCR machine to make the whole system more efficient. The Flurometer is included to make our results more accurate, and make analyzing the DNA easier.
Major Strength: Accurate Major Weakness: Time for procedure Heating: extreme pulses of heat Cooling: extreme pulses of cool air
Major Strength: Easy to use Major Weakness: Too much excess light Redesigning the container to limit the amount of light interfering with the samples
| |||||||||||||||||||||||||||||||||||||||||||||||||||||||||||||||||||||||


