BME100 s2015:Group6 9amL3
| Home People Lab Write-Up 1 | Lab Write-Up 2 | Lab Write-Up 3 Lab Write-Up 4 | Lab Write-Up 5 | Lab Write-Up 6 Course Logistics For Instructors Photos Wiki Editing Help | |||||||||||||||||||||||||||||||||
|
OUR TEAM
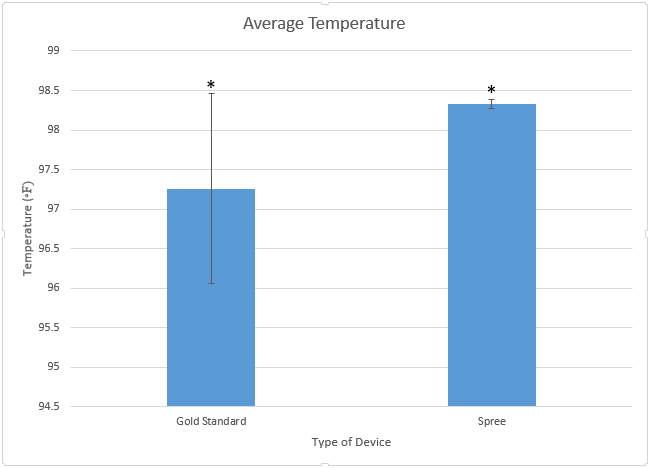
LAB 3A WRITE-UPDescriptive StatisticsMean
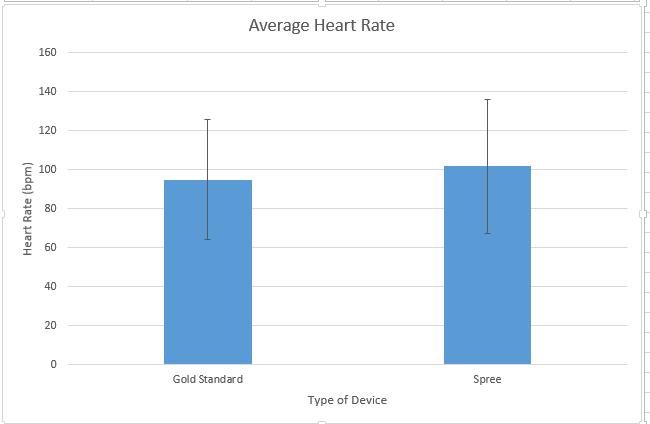
Variability (Heart Rate)
Results
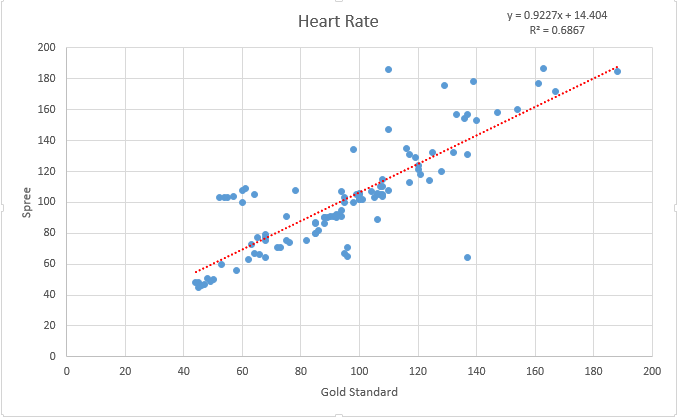
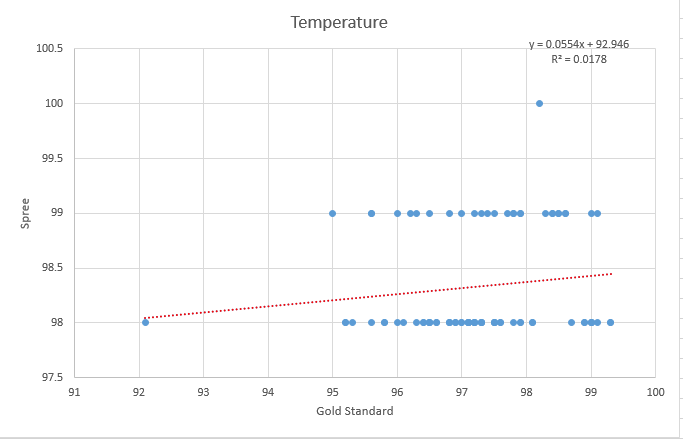
AnalysisA paired t-test was used to compare the data because the data was measured using two devices. A paired t-test made it easiest to compare the data side by side and see the correlation. Heart Rate P-value attained from t-test: .121 Pearson's R: .829 Temperature P-value attained from t-test: 6.11 E-13 Pearson's R: .133 With a p-value of .121 for the heart rate, the data is not statistically significant because .121 is greater than .05. Because the data is not statistically significant it can be concluded that the spree is not able to accurately measure heart rate. The value of .829 for the Pearson's R means that there is a strong positive correlation between the data sets of the spree and the gold standard. This is because the value .829 is positive and close to 1. With a p-value of 6.11 E-13 for the temperature, the data is statistically significant because 6.11 E-13 is much less than .05. Because the data is statistically significant, it can be concluded that the spree is capable of accurately measuring temperature. The value of .133 attained for the Pearson's R means that there is a weak positive correlation between the data sets of the spree and the gold standard. This is because the value of .133 is positive and not close to the value of 1.
Summary/DiscussionThe Spree device does not satisfy the consumers needs. During the lab, our first two spree devices could not link up to the app through bluetooth. Instead, we had to collaborate with another group for data. For our physical activity, the subject had to play intense ping pong for an hour. After five minute increments, heart beat and temperature were measured from the spree device and using a thermometer and pulse oximeter. During the experiment, however the subject went outside the bluetooth radius at one moment that could have skewed the data. Another problem with it is that temperature was difficult to record as it used a confusing was to record it. In the app, it showed colors to represent temperature and not actual data which mad the process of recording and analyzing the temperature an extra step that shouldn't have happened. Finally there is the data and how it was compared to Gold or controlled group. While it stay within range of some measurements, it was also all over the place in many areas. In the end, while the spree was an innovated device, it need improvements before it can be a serious device to record health. Some adjustments that can be made is using another wireless tracking method other than Bluetooth and it was proven difficult to use. Another way to improve is making data easier to read and understand as the output now is difficult to understand. Finally, that last thing the spree can improve on is use use better sensors to track measurements as it was proven to get some results wrong. I know these demands seem a lot, but its more now that spree becomes a functional device for everyone to use.
LAB 3B WRITE-UPTarget Population and NeedSports Measurement: Sports: - Golf - Swimming - Baseball Target Population: - Athletic people - Age range: 15-45 and those who play sports Measures: - speed of stroke (arm movement) - calories burned - heart rate
- stylish compression sleeve with biomarkers - stylish app that uses bluetooth - user friendly - inexpensive - long battery life/easily changeable battery - long warranty - water proof - durable/shock proof - spandex-type material
Device DesignCompression Sleeve - comes in many colors (black, white, grey, red, orange, yellow, green, blue, purple, pink) - contains biomarkers at wrist, elbow, and shoulder - bluetooth admitted/receiver - dry fit App: - profile to put in personal data/pick your sport - easy to use/understand - caters to each sport - runs concurrently with sleeve - tabs for calories burned, heart rate, and speed of strokes (arm movement)
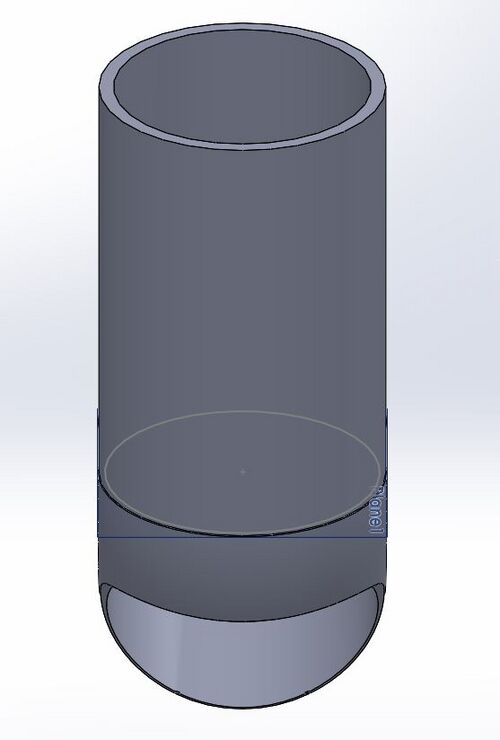 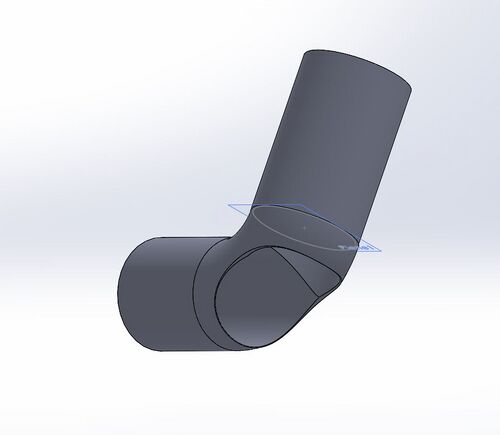 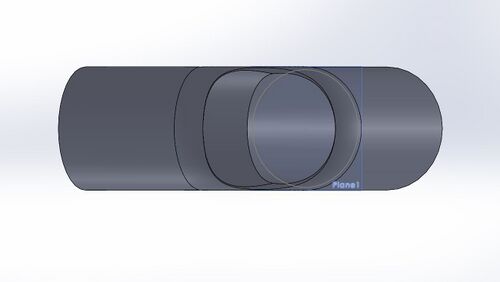 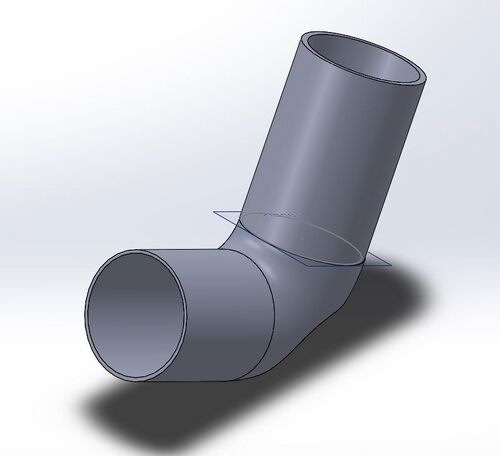 
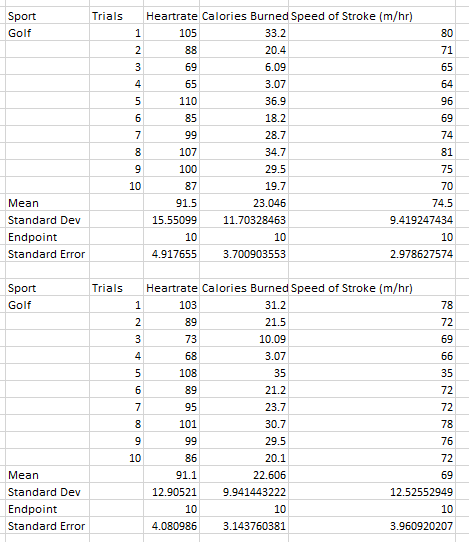
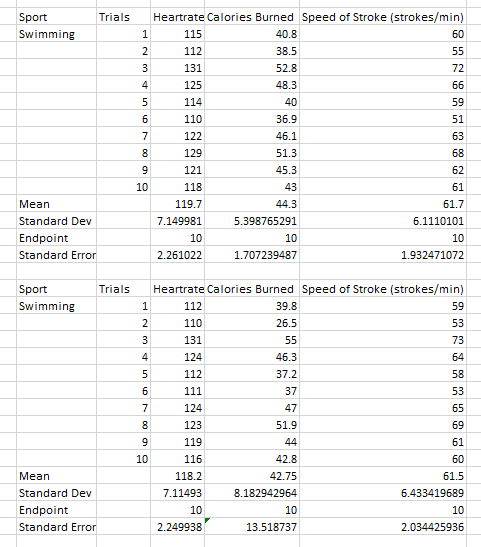
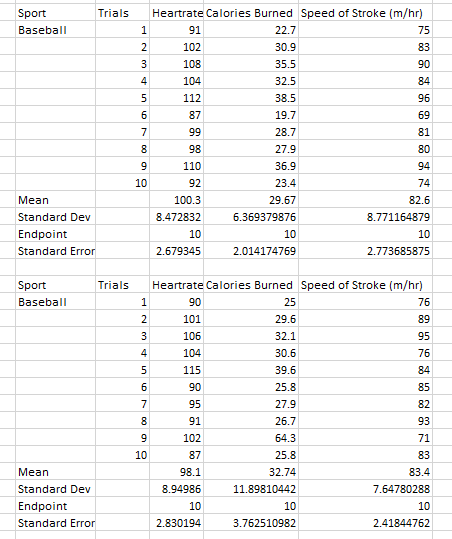
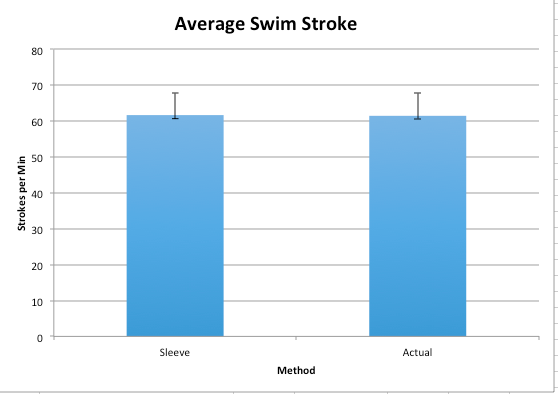
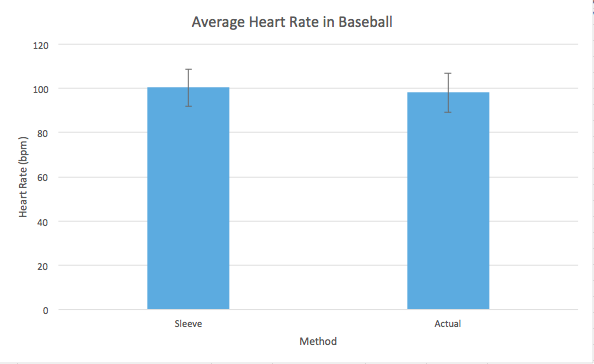
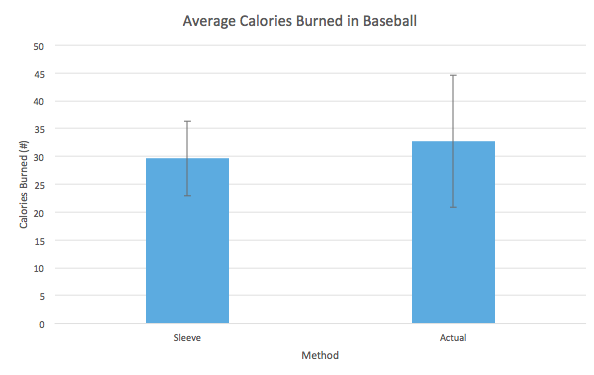
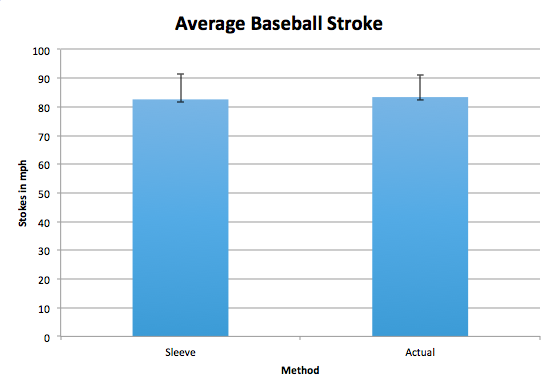
Inferential Statistics
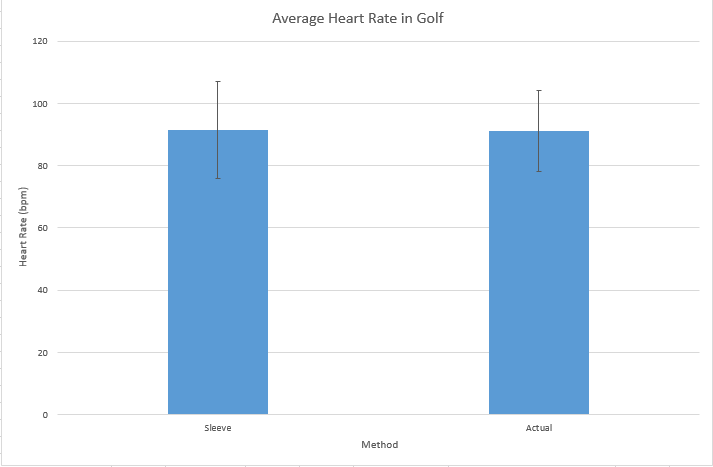
Graph
|
|||||||||||||||||||||||||||||||||


