BME100 s2015:Group6 12pmL6
| Home People Lab Write-Up 1 | Lab Write-Up 2 | Lab Write-Up 3 Lab Write-Up 4 | Lab Write-Up 5 | Lab Write-Up 6 Course Logistics For Instructors Photos Wiki Editing Help | ||||||
|
OUR COMPANY
LAB 6 WRITE-UPBayesian StatisticsOverview of the Original Diagnosis System The BME 100 Class used a polymerase chain reaction to test patient samples for a disease-associated SNP. The class was split into 26 teams of approximately 5 students. A total of 52 patients were tested for the SNP, with each team testing 2 patients each. Each patient had 3 replicates of their DNA sample. This was done so that the lab could use an average of the 3 results, in case there was an error or inaccuracy in one sample's testing. The DNA samples were added to a primer mix and run through a PCR thermal cycling machine. The maximum number of replications is usually achieved at ~32 cycles. To eliminate any possible errors, a total of 35 cycles were run to ensure the maximum number of replications had been reached. Once all cycles were completed, the samples underwent a final hold at 4°C. They were held at this temperature for a week in between lab sessions. This was to prevent any of the newly formed DNA strands from separating between the completion of PCR and the fluorometer analysis. After PCR was completed, the DNA samples were analyzed using a fluorometer and the ImageJ software. The DNA samples were mixed with a SYBR Green I solution and placed in a fluorometer. Each of the patient's 3 replicates was analyzed, along with a positive and negative control. To analyze, a smartphone image was taken of each droplet in the fluorometer and uploaded to a computer. The ImageJ software was then used to analyze the images. In Image J, the measurement settings were first changed to display: Area, Integrated Density, and Mean Grey Value. After the selected image was imported, it was split into its individual channels: red, blue and green. The only channel used for this analysis was the green channel image, because that is the color the SYBR Green solution fluoresced. When selecting the part of the sample droplet to be analyzed, it was important to not select the brightly colored edges of the droplet, as this is where the fluorometer light was entering and exiting the droplet. Including this in the measurement would cause greater inaccuracies in the data. Each unique sample drop had three separate images taken of it. The average value of these three images is what was used for the value for that replicate. This was to account for possible light contamination or poor image quality affecting the measurements. Once the values were calculated, these results were recorded on a spreadsheet. Once completed, all 26 teams uploaded their results, which were added to one master spreadsheet. Each group's results were uploaded for each patient. Each replicate was determined to be either a "positive" or "negative" result, based on whether its values were more similar to those of the positive or negative control values. Ideally, all of a patient's replicates had the same conclusion for containing diseased or non-diseased DNA. This would be considered a successful conclusion. In some cases, the sample DNA values were in between the positive and negative values, deeming it inconclusive. Other data sets that displayed obvious errors were highlighted in the spreadsheet and disregarded from the Bayes statistics calculations. What Bayes Statistics Imply about This Diagnostic Approach
Calculation two was used to determine the probability of a negative final test conclusion given negative PCR results. What was being evaluated was if the patient received negative PCR results, did they also receive a negative final conclusion? While slightly smaller than calculation 1, the probability of this was also very close to 1 (100%), indicating a very probable occurrence. There were multiple sources of human error that could have negatively impacted the calculated Bayes values. Most likely the greatest factor affecting the calculations, was incompetence in using the ImageJ program. Only 3 out of 26 teams correctly diagnosed both of their patients, with Group 6 being one of them. Many students were simply not using the correct method in analyzing images in the software. Another error was the quality of images being taken for use in image analysis. Even with proper settings, many smartphones were not able to capture high quality images of the DNA samples. A blurry, low quality image will not be accurately analyzed in the software. Additionally, some teams were not properly using a labeling system for their PCR tubes. This resulted in those teams' negative controls showing a higher RAWINTDEN value than the positive controls. This also, however, could have been attributed to incorrect analysis in ImageJ.
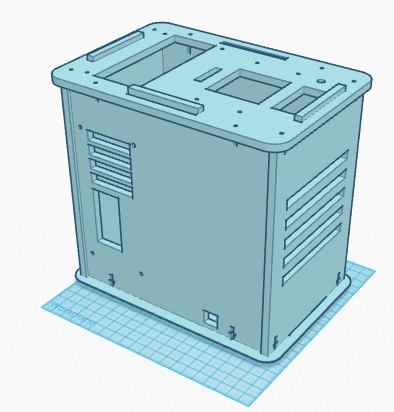
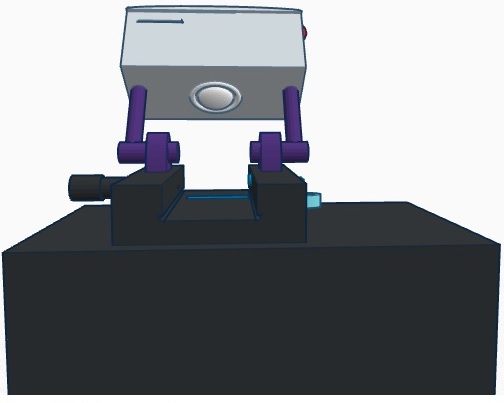
Calculation 4 determined the probability of the patient not actually developing the disease, given a negative final test conclusion. The probability of this occurrence was slightly less than 1 (100%). Therefore, it can be determined that a correct negative final test conclusion was much more probable than a correct positive final test conclusion. Of the patients that were given a negative final test conclusion, roughly 90% of them did not actually develop the disease. Computer-Aided DesignTinkerCAD The TinkerCAD tool is an online 3-D design program that allows the user to create almost any design imaginable. The designs created in TinkerCAD can be sent to 3-D printers to be created. In the lab, the tutorial lessons were first completed in order for our group to obtain a basic understanding of the functionality of the program. Next, the already created pieces of the PCR machine were imported and assembled together to create the complete machine. Once that was complete, TinkerCAD was used to develop our group's design for our improved fluorometer. First, using an actual fluorometer as reference, the original fluorometer was designed in the program. Next, the improvements we made to it were incorporated into the design. Our Design Front View
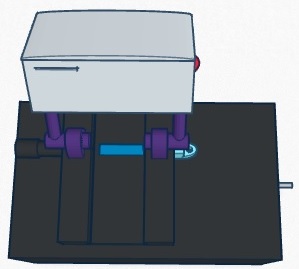
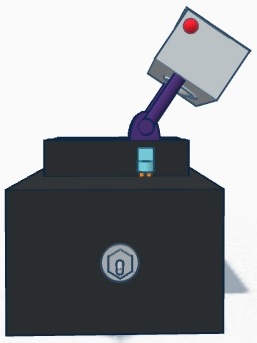
Our design differs from the original fluorometer design in that it incorporates a self-contained camera. The camera mounts on to arms that mount on to either side of the slide platform. The arms are then able to be rotate between two different positions. The camera mount can be in the upward position so that it is out of the way for sample droplets to be placed onto the slide. After the slide is in position, it is rotated to the downward position where the camera is at an ideal angle for capturing images for analysis. The camera also houses a slot for an SD card. The images taken by the camera are automatically saved onto the SD card, which can then be easily removed and inserted into a computer for image analysis.
Feature 1: Consumables KitConsumables Kit Contents:
Feature 2: Hardware - PCR Machine, Fluorometer, and MicropipettorThe PCR machine had several shortcomings when it came to performing its primary task of thermal cycling. The machine required the use of a computer connection and its own software, called OpenPCR. For the purposes of this lab, it was not a major inconvenience because there were computers all around the lab already loaded with the software. However, this is not the case in all labs.
| ||||||


