BME100 s2015:Group6 12pmL3
| Home People Lab Write-Up 1 | Lab Write-Up 2 | Lab Write-Up 3 Lab Write-Up 4 | Lab Write-Up 5 | Lab Write-Up 6 Course Logistics For Instructors Photos Wiki Editing Help | ||||||
|
OUR TEAM
LAB 3A WRITE-UPWhat are the design flaws of the Spree headband? How valid is it in comparison to the current gold standard devices? Descriptive StatisticsBody Temperature
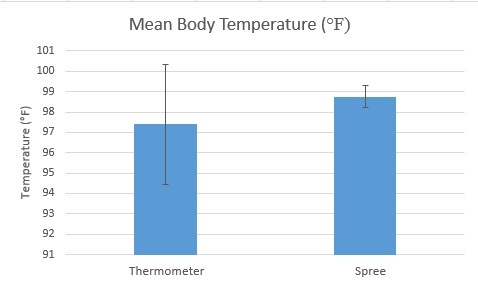
Mean: 97.39 degrees F Standard Deviation: 2.95 degrees F Standard Error: 0.16 degrees F
Mean: 98.74 degrees F Standard Deviation: 0.54 degrees F Standard Error: 0.03 degrees F
Heart Rate
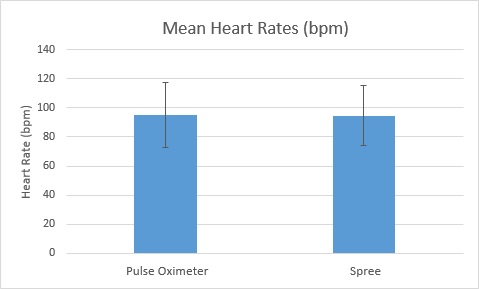
Mean: 95.06 bpm Standard Deviation: 22.58 bpm Standard Error: 1.24 bpm
Mean: 94.62 bpm Standard Deviation: 20.63 bpm Standard Error: 1.13 bpm
Results
AnalysisInferential Statistics
Pearson's R: 0.0086 T. Test: 1.14*10^-15 The Pearson's R Coefficient indicates that there is very little correlation between the temperature recorded by the Spree and the oral thermometer. The fact that the t-test produced a p value less than .05 means there was a statistically significant difference between the two temperature groups. There should not be a difference if the Spree device measured the temperature accurately.
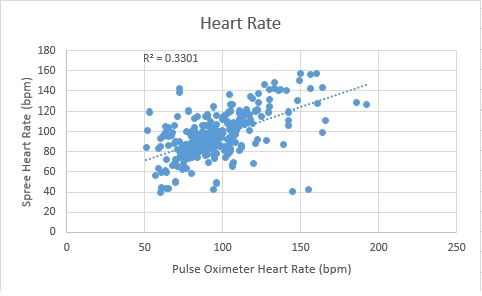
Pearson's R: 0.57 T. Test: 0.69 The Pearson's R for heart rate indicated that there was a positive correlation between the Spree and pulse oximeter measurements. A complete correlation would produce a 1.0 Pearson's R value, so the measured value of 0.57 for the heart rate implies a partial positive correlation. Because the p-value was so much higher than the threshold value of 0.05, there was not a statistically significant difference.
Summary/DiscussionThe Spree headband had an abundance of design flaws. The temperature sensor only assigned a rating of 1-4, but did not measure the actual temperature. The entire device would also power off if there was not enough movement, such as when the user was at rest. This could be easily remedied by modifying the device so it will not turn off at rest. It lacked unique identification, which made it difficult to differentiate between multiple devices in a close proximity. An option to add custom device ID's to each device would resolve this. The wireless connectivity was also very unreliable. It disconnected multiple times after initially pairing with the mobile device. The band materials are not effective in handling sweat. An easy solution to this would be wrap the forehead piece with a polyester/nylon cover. The headband itself is not aesthetically pleasing, which could be resolved by offering multi-colored polyester/nylon wraps.
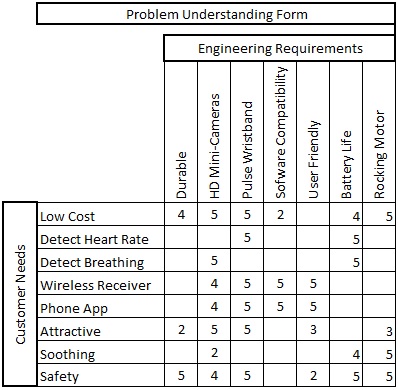
LAB 3B WRITE-UPBased upon the observed flaws of competing industry devices, design an improved body monitoring device. Target Population and NeedThe SmartCrib is targeted towards any parents with a baby that sleeps in a crib. With over 3.9 million babies born annually in the United States alone, there is a huge demand for this type of product. With approximately 2,500 infant deaths per year attributed to SIDS in the United States alone, the SmartCrib would be highly sought after. SIDS is a major concern for many new parents because there are no warning signs or prevention methods. In order to be put at ease, parents need a "guardian" watching over their infant while they sleep. New parents will also benefit from the reduced occurrences of having to get up during the night to comfort their crying baby.
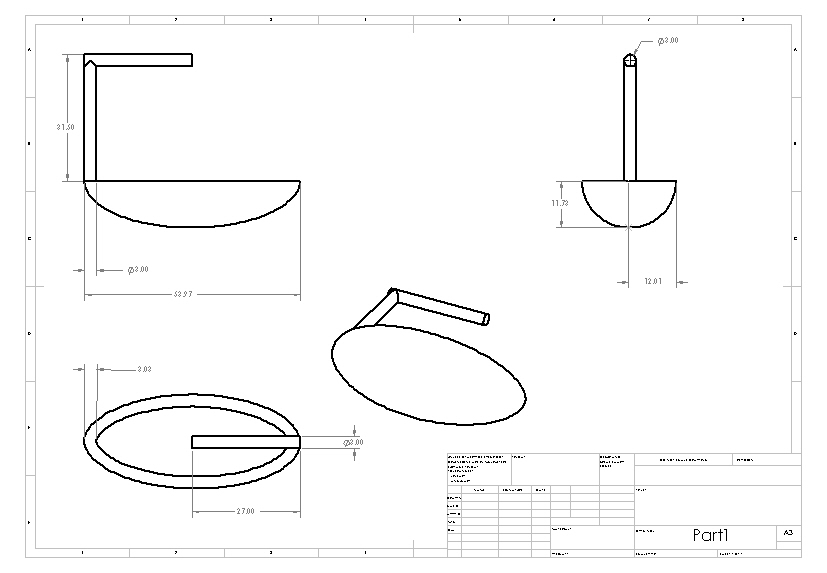
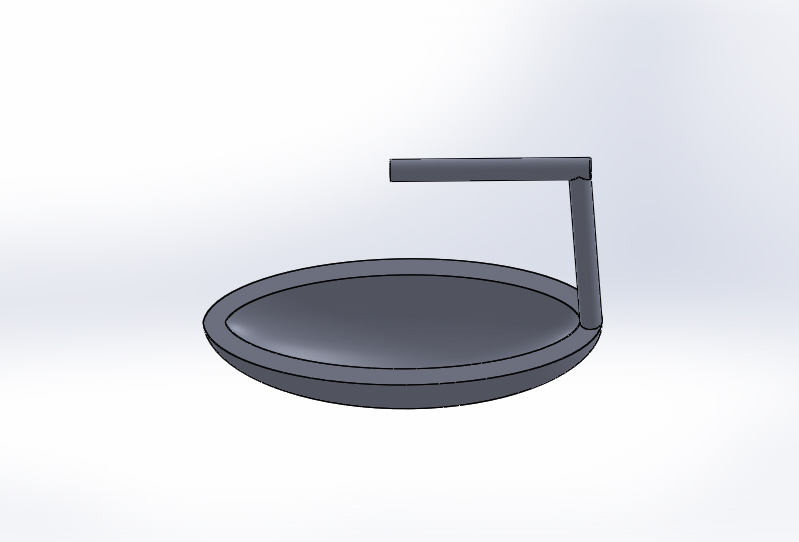
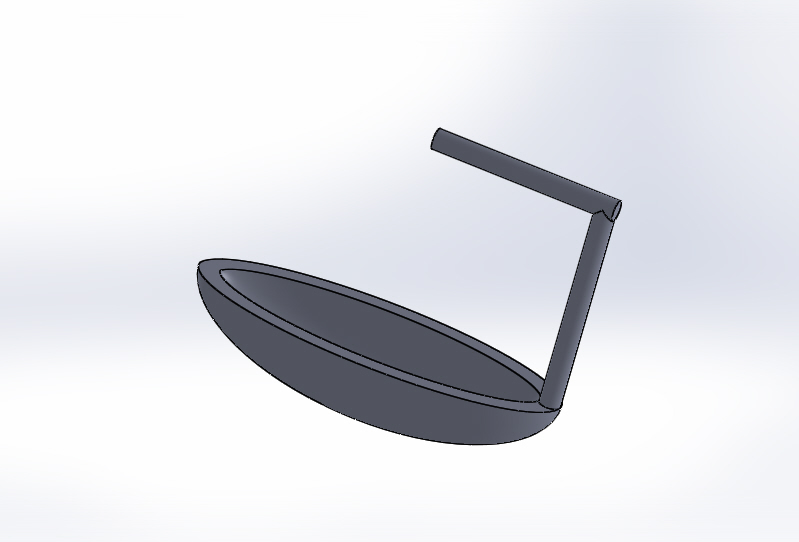
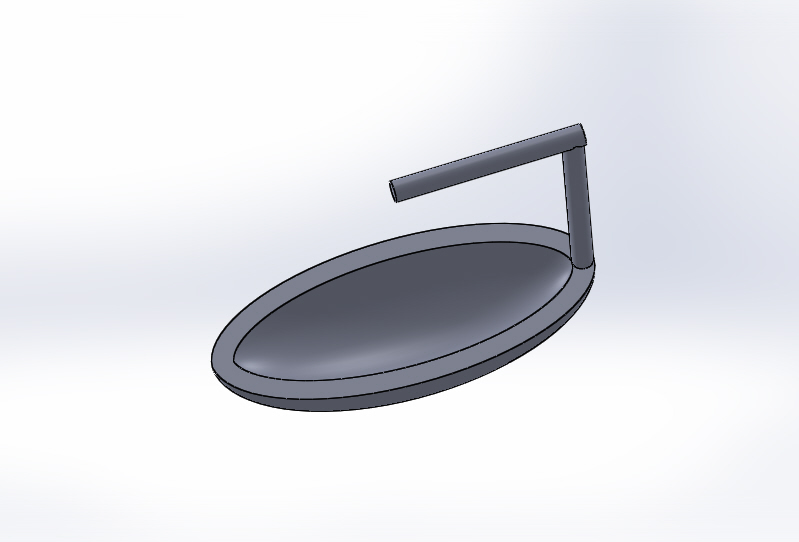
Device DesignThe SmartCrib is ideally designed to put parents of newborn babies at ease during the night. Its innovative spherical shape allows your baby to be cradled, imitating a parent holding a baby. Functioning as a rocking chair, the crib detects discomfort in your baby and gently rocks it back to sleep. In addition, the crib can identify the cause of discomfort and efficiently sends a text message to the parents, alerting them if the baby needs to be fed or changed, or for any other given reason.
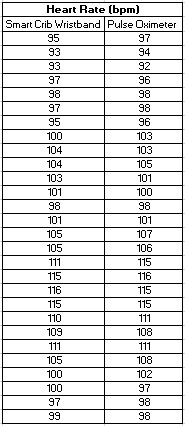
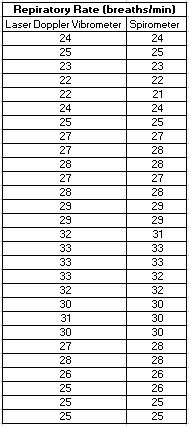
Data & StatisticsExperimental Data
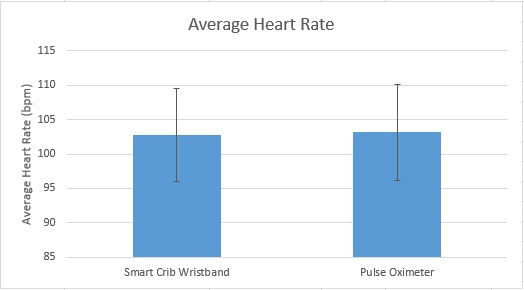
Mean: 102.75 bpm Std. Deviation: 6.80 bpm Std. Error: 1.29 bpm
Mean: 103.18 bpm Std. Deviation: 7.00 bpm Std. Error: 1.32 bpm
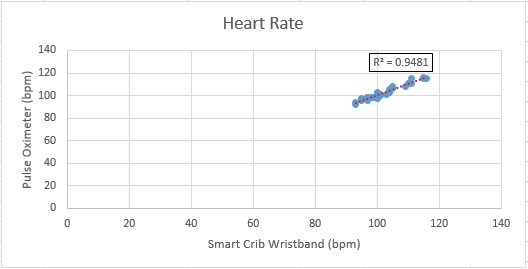
T. Test: 0.167 Pearson's R: 0.974 P-Value: 3.15071*10^-18
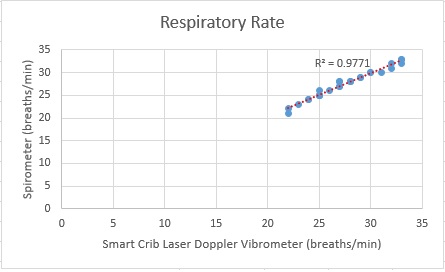
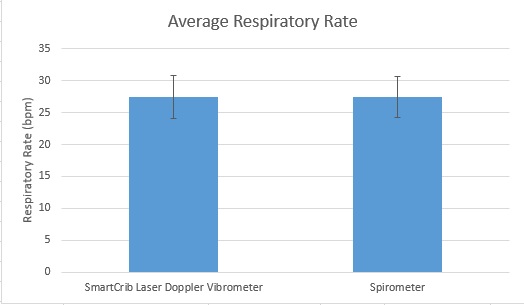
Mean: 27.5 breaths/min Std. Deviation: 3.34 breaths/min Std. Error: 0.63 breaths/min
Mean: 27.46 breaths/min Std. Deviation: 3.25 breaths/min Std. Error: 0.61 breaths/min
T. Test: 0.713 Pearson's R: 0.988 P-Value: 7.4498*10^-23
Graph
|
||||||


