BME100 s2015:Group6 12pmL2
| Home People Lab Write-Up 1 | Lab Write-Up 2 | Lab Write-Up 3 Lab Write-Up 4 | Lab Write-Up 5 | Lab Write-Up 6 Course Logistics For Instructors Photos Wiki Editing Help | ||||||
OUR TEAM
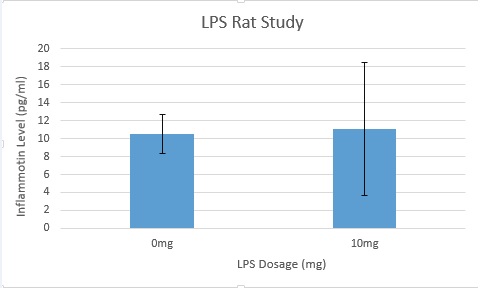
LAB 2 WRITE-UPWhat is the lowest possible dose of lipopolysaccharide (LPS) that will increase Inflammotin levels in the elderly? Descriptive StatisticsRat Study 0mg Group Mean: 10.516 pg/ml Standard Deviation: 2.226 pg/ml Standard Error: 0.995 pg/ml
Mean: 11.112 pg/ml Standard Deviation: 7.403 pg/ml Standard Error: 3.310 pg/ml
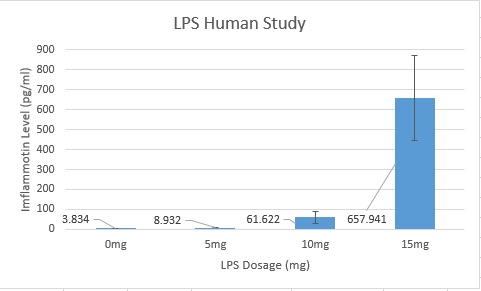
0mg Group Mean: 3.834 pg/ml Standard Deviation: 1.523 pg/ml Standard Error: 0.482 pg/ml
Mean: 8.932 pg/ml Standard Deviation: 1.594 pg/ml Standard Error: 0.504 pg/ml
Mean: 61.622 pg/ml Standard Deviation: 30.111 pg/ml Standard Error: 9.521 pg/ml
Mean: 657.941 pg/ml Standard Deviation: 212.943 pg/ml Standard Error: 67.338 pg/ml
ResultsLPS Rat Study
AnalysisRat Study For the rat study, the T-Test was used because there were only 2 groups. When the test was ran, it gave the following value: P-Value= 0.867403497 Since the p-value is greater than 0.05, there is no significant statistical difference between the two groups.
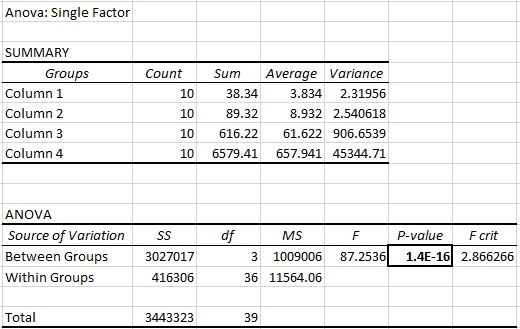
For the human study, the One-Way ANOVA test was used because there were more than two groups being compared.
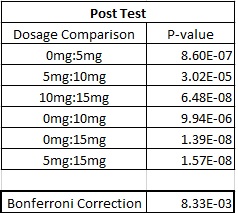
Post-Test To establish the Bonferroni Correction, the Alpha Value (.05) was divided by six (the number of post-test comparisons). Then, the p-values were compared to the Bonferroni Correction. Since all of the post-test p-values were smaller than the Bonferroni Correction, there was a significant statistical difference for each of the comparisons.
Summary/DiscussionIn the study on rats, the LPS had a minimal impact on the Inflammotin levels. The p-value from the T-test was 0.867, indicating that it was not statistically significant. When the same study was conducted on humans, the LPS dosage had a much greater impact on subjects' Inflammotin levels. The p-value from the ANOVA test was 1.40*10^-16, indicating that it was statistically significant. From the results, it can be concluded that the LPS impacted the Inflammotin levels in humans much more than it did in rats. |
||||||


