BME100 s2015:Group5 9amL6
| Home People Lab Write-Up 1 | Lab Write-Up 2 | Lab Write-Up 3 Lab Write-Up 4 | Lab Write-Up 5 | Lab Write-Up 6 Course Logistics For Instructors Photos Wiki Editing Help | ||||||||||||||||||||||||||||||||||||||||||
|
OUR COMPANY
LAB 6 WRITE-UP
We forgot to put this into the last lab report. Bayesian StatisticsOverview of the Original Diagnosis System The labor of testing each of the 16 patients was divided among 8 lab groups, each made up of 4-5 BME 100 students. Each group was given two unidentified samples to test for Type I Diabetes using SYBR Green 1 as an indicator of positive or negative. Positive samples were shown to glow green when photographed while negative samples remained relatively inert and somewhat colorless. Three replicate tests were performed per patient, and the results from these tests factored in the ultimate diagnosis for that patient. Any questionable result was labelled "inconclusive," and discounted from the whole of the data. Three drop images were used in ImageJ in which a fixed area of these images containing the colored or uncolored pixels of the tested sample were put through 5 calibration controls (0.25, 0.5, 1, 2, 5) the three pictures were analyzed and compared with the images of the positive and negative control samples. Data that contained abundant error that threw off experimental results was disregarded, as per instruction from the instructor that lab period in order to reduce error. Overall, there were a total of 48 replicate tests performed. Of these 48, only 42 were counted since the results of a single group were entirely disregarded. 16 out of 42 of the samples turned out to be positive when tested, however these positive results only factored into 4 absolutely positive diagnoses, out of a possible 13. 25 out of 42 of the samples tested negative, however these negative results only factored into 6 absolutely negative diagnoses, out of a possible 13. Only the results for a single patient turned out to be inconclusive upon initial testing. What Bayes Statistics Imply about This Diagnostic Approach Bayesian Statistics Equation (Used in all Calculations) P(A|B) = {[P(B|A) * P(A)] / P(B)} * 100% Calculation 1 Calculation 1 involved determining the probability that any given sample has the Type I Diabetes DNA sequence given a positive diagnostic signal. In which:
Calculation 2 Calculation 2 involved determining the probability that any given sample does not have the Type I Diabetes DNA sequence given a negative diagnostic signal. In which:
Calculation 3 Calculation 3 involved determining the probability of a patient developing Type I Diabetes given a Diabetes DNA sequence. In which:
Calculation 4 Calculation 4 involved determining the probability that a patient will not develop Type I Diabetes given a non-Diabetes DNA sequence.
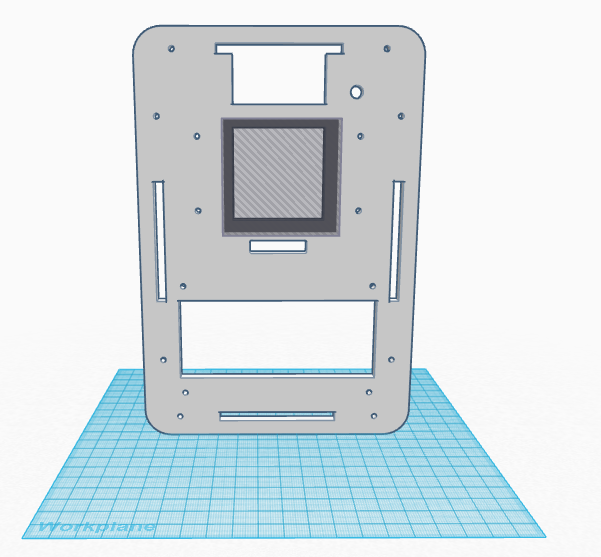
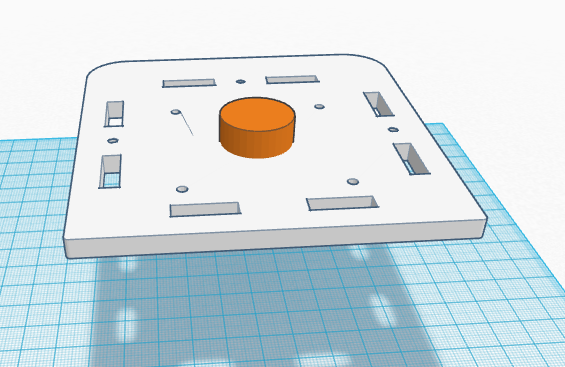
Computer-Aided DesignTinkerCAD Our Design This is the top of the open PCR machine. In our design the area where the PCR tubes are held was increased by two columns so the darker box is the new region that is taken up by the PCR samples. This was done because open PCR takes a long time and it would be better if you could get more done in the same amount of time. Also not shown in the picture is a change to the LED display. Normally it only shows the temperature and the estimated time remaining, but in our device it shows both of those and the step it is on. This was simply a minor quality of life change. This is the top of the box which is on top of the open PCR machine. In our design the old knob was taken off and replaced with one that is easier to adjust and is more accurate. This was done because the old knob was bulky and hard to adjust and this new one makes up for it. Also not shown in the picture is that the box is no longer snap on and off, it is magnetic. This was done because it was hard to open and even harder to properly close, with a magnet it would be much easier to do both of these tasks.
Feature 1: Consumables KitThe consumable kit will contain a box of disposable gloves, and will prove everything else that is needed for the experiment. The items the kit will contain will be the test tube that are needed of the PCR experiment, there will be 10, the capacity of the tubes will be 100 miro-liters. Eight of them will be for the experiment itself and the last two will be extra if any errors do occur. There will also be a 10X10 box of micro-pipett tips. Those will be in a sterile container that will not have any contaminates. There will also be a tray were the test tubes can be placed during the experiment. The weaknesses that this kit has is that there is no disposable bag that comes along with it. The waste will have to go to in the designated hazard bins in the lab. Feature 2: Hardware - PCR Machine & FluorimeterPCR Machine: The redesigned PCR machine will have an easier to open lis that has a latch to secure it open and closed. Also there will be a much more accurate reading that new PCR machine will do. Also to control the temperature of the insides will be more accurate with the new knob that will be added. The old PCR machine had its weaknesses and strengths. The weakness was that is was to long per test, and the strength was that is was accurate.
| ||||||||||||||||||||||||||||||||||||||||||


