BME100 s2015:Group4 9amL2
| Home People Lab Write-Up 1 | Lab Write-Up 2 | Lab Write-Up 3 Lab Write-Up 4 | Lab Write-Up 5 | Lab Write-Up 6 Course Logistics For Instructors Photos Wiki Editing Help | ||||||
OUR TEAM
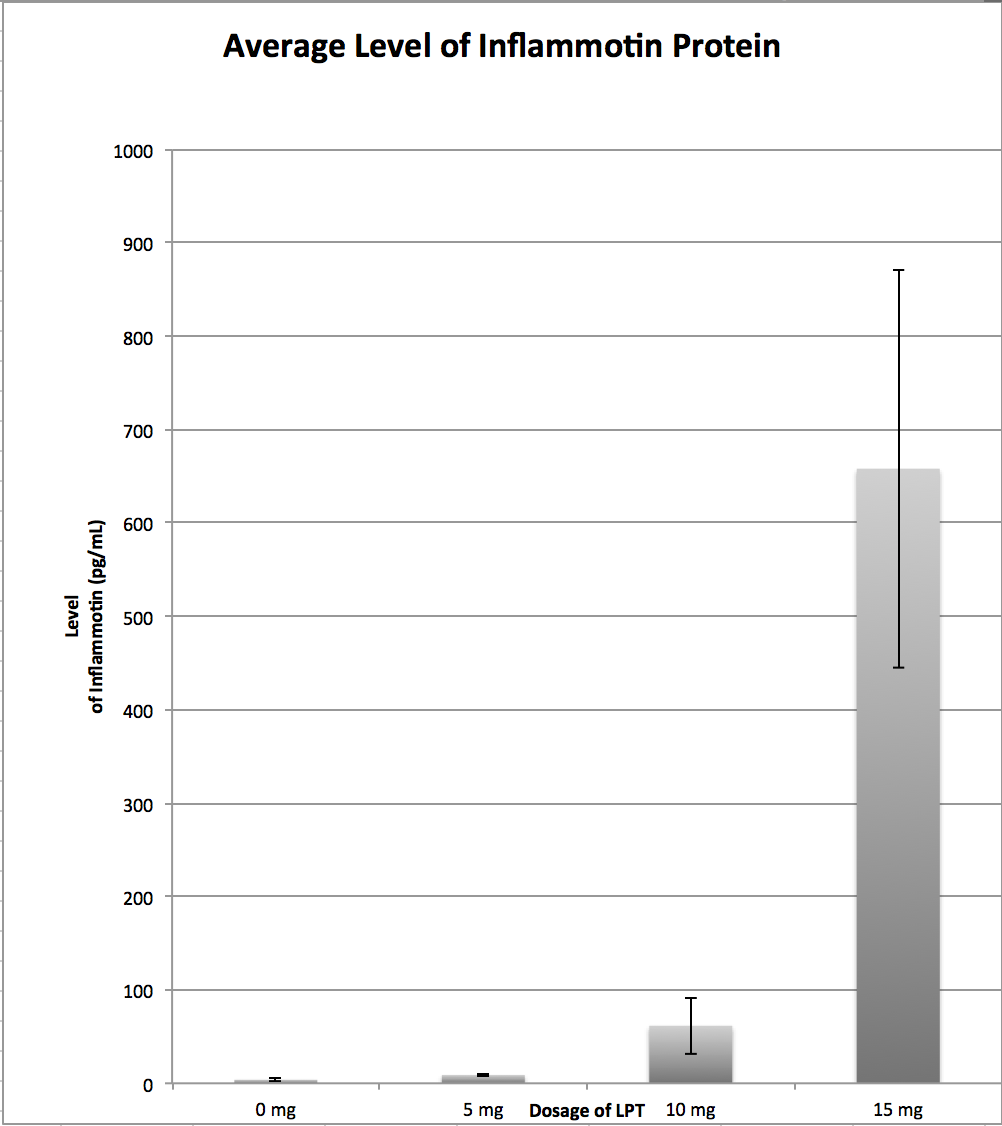
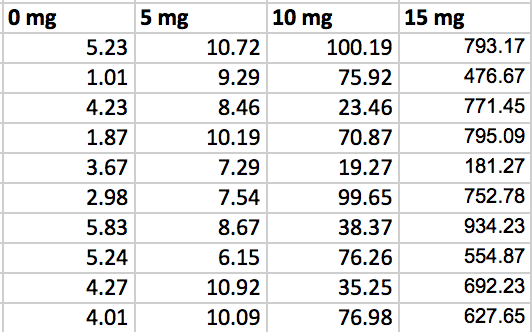
LAB 2 WRITE-UPDescriptive StatisticsExperiment 1 - Human Study 0mg LPS Dose 5mg LPS Dose 10mg LPS Dose 15mg LPS Dose Experiment 2 - Rat Study 0mg LPS Dose 10mg LPS Dose ResultsExperiment 1- Human Study
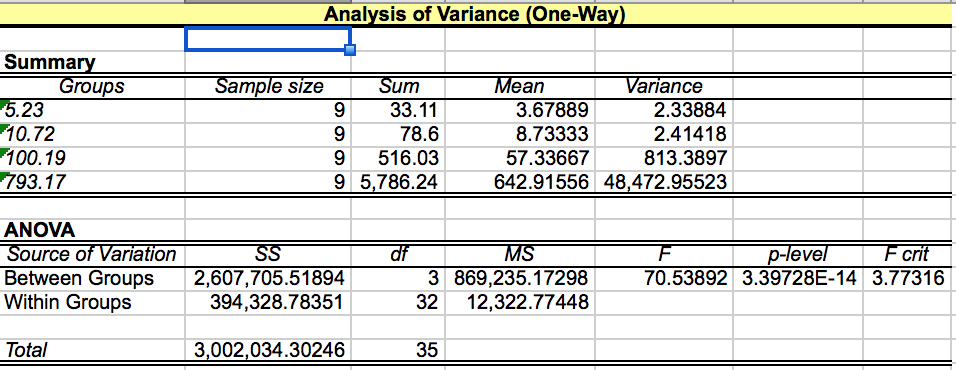
AnalysisExperiment 1 - Human Study For the human study, an ANOVA test will be done, because we are trying to determine whether there is a significant difference between more than two groups of data. The human study contains four groups of data based on dosage. According to the ANOVA, the p-value is 3.39728E-14, which is less than the given alpha value of .05, which means there is a statistically significant difference between the treatments. Because it is less than the alpha, individual comparisons must be done in order to determine if there is a significant difference between each of the dosages. In order to determine if there is a significant difference between each of the tests, we conducted individual comparisons. A Bonferroni correction must be done because there are a total of six post-hoc tests. The alpha of .05 must be divided by 6 because there are six comparisons done in the test. According to the data from the individual t-tests, each of the tests resulted in a p-value less than the Bonferroni correction, so the results of each dosage are significantly different.
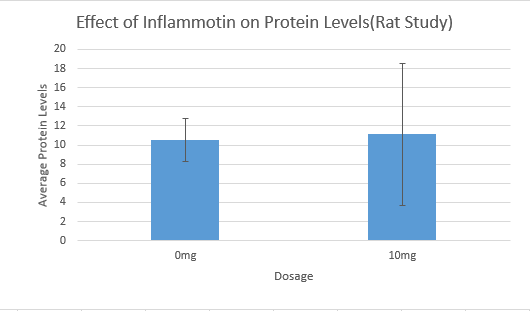
After running the T.Test the t-value came out to be 0.867403497. The ideal p-value is 0.05, whereas the t-value was relatively higher which indicated that the data collected is not significant. There is no other comparisons that are necessary for the values. Going back to the rat study, there is no real difference between the 0mg test and the 10mg test.
Summary/DiscussionIn the first experiment involving the human study, an ANOVA was done in order to determine whether there was a significant difference between the levels of Inflammotin protein found in individuals given different dosages of LPT. According to the ANOVA, the p-value was less than the alpha of 0.05, meaning that there was a significant difference each of the dosage groups. Then, t-tests was done with Bonferroni corrections was done in order to determine which groups were significantly different. According to the Bonferroni correction, the alpha value was changed to .05/6, because six different groups were being compared. After each of the t-tests were completed, all of t-test values were less than the corrected p-values, suggesting that there is a significant difference between all of the groups. Each dosage had a different effect on the levels of inflammatin. In the second experiment, the effect of LPS on level of Inflammatin was examined in rats. A t-test was conducted on rats because there are only two groups being compared, one group given a 0 mg dosage and another group given a 10 mg dosage. According the the t-test, the determined value was 0.867403497, greater than the given alpha value of 0.05. This means that there is no significant difference between the dosages given to the rats and their levels of Inflammatin protein. In comparing the two data sets, it can be seen that there is a significance in levels of Inflammatin in the human study rather than the rat study. For future experiments, tests involving LPT and it's effect on levels of inflammatin should be done on humans so that significant differences can be detected. |
||||||


