BME100 s2015:Group4 12pmL6
| Home People Lab Write-Up 1 | Lab Write-Up 2 | Lab Write-Up 3 Lab Write-Up 4 | Lab Write-Up 5 | Lab Write-Up 6 Course Logistics For Instructors Photos Wiki Editing Help | ||||||||||||||||||||||||||||||||||||||||||||||||||||||||||||||||||||||||||||||||||||||||||||
|
OUR COMPANY
LAB 6 WRITE-UPBayesian StatisticsOverview of the Original Diagnosis System For the division of labor, 52 patients were divided up between two classes. For the first class, 16 patients were divided two patients per group, with 8 groups total. For the second class, 36 patients were divided two per group, with 18 groups total. There were many practices used in this lab to prevent error. Initially, the tubes needed to be prepared using specific concentrations of PCR mix and DNA to use for the PCR reaction. To insure that pipetting skills were up to par, each group had to present a series of tubes with the correct color and volume for verification. For each patient, three samples were made, in case there was an error with one tube, the other two tubes would be able to compensate for the error. There was also a positive control and negative control for SNP, so that the patient's samples could be compared to this in the end. After the PCR reaction, the next step was to take pictures of the DNA with SYBR Green dye solution illuminated by a blue laser. This was accomplished inside a box, so that outside light would not interfere with the drops. The distance from the smartphone to the slide was kept constant for every picture taken in the lab. Three pictures of each drop were taken, which corresponded to one of the three samples for each patient. Record was kept of the pictures taken to insure that the pictures analyzed corresponded to the correct source tube. Three pictures were also taken of the positive and negative control. Three pictures of 5 known DNA concentrations and a sample of with 0 DNA were taken to construct a curve to plot the unknown concentration of the patient's samples and the controls on. ImageJ was used to analyze each individual picture's DNA INTDEN value, by subtracting the RAWINTDEN of the background from the RAWINTDEN of the drop. Before analyzing the drop, each picture was split into green, red, and blue; green was used because SYBR Green illuminates green. These values averaged over the three pictures, were used to make one single INTDEN value, plotted against the known concentration. The patient's samples and the controls were then put into ImageJ to get the INTDEN value, which could then get the concentration based on the plot from the known concentrations. The three conclusion from each patient were then used to determine whether the patient had the SNP gene or not, based on the positive and negative control values. For the class data set, all but 3 groups submitted data. All the groups from class 1 submitted acceptable data, for a total of 8 groups. Of the data present for class 2, 5 groups submitted unacceptable data, leaving only 9 groups from class 2. Of this data, one test of one group from class 1 submitted an "INCONCLUSIVE" conclusion.
What Bayes Statistics Imply about This Diagnostic Approach
Calculation 2 is responsible for showing the chance that the patient does not have the SNP DNA sequence, given a negative test result. In this test, A represents the number of NEG conclusions, out of all of the conclusions given. B represents the number of neg PCR reaction, out of all the PCR results. The value of P(B|A) for this test represents the chance of neg PCR reactions, given a NEG conclusion. This test tests for specificity because it looks at the no having the disease, or the negative results. The calculated value for this is close to 1.00, which means that if a patient is given a negative test result, then it is likely that the patient does not have the SNP DNA sequence. Because of this, it can be inferred that the reliability of the PCR to determine if a person has the SNP DNA, is fairly good. Calculation 3 is responsible for showing the probability of a patient actually developing cancer, after they have been given a POS conclusion; that they have the cancerous SNP gene. For this test, the value of A represents the fraction of yes cancer diagnoses, over all the cancer diagnoses. B is represented by the frequency of POS conclusion, out of all conclusions given. P(B|A) is represented by the number of POS conclusions given a yes cancer diagnosis. This test tests for sensitivity, since it is looking into the positive diagnosis, after a POS conclusion has been given. The calculated value is slightly closer to 0, than to 1.00, which only gives a marginal chance for developing the disease after a POS conclusion. This shows that this test is not very reliable, as only about half of the results will correctly predict for developing the disease. Calculation 4 is responsible for showing the probability that a patient will not develop the disease, after a NEG conclusion is given; that they do not have the SNP gene. For this test, the value of A is determined by the fraction of no cancer diagnoses, over all of the cancer diagnoses. B is obtained through the frequency of NEG conclusions, over all of the conclusion from the class. P(B|A) is the relationship found between NEG conclusions, given a no cancer diagnosis. This test tests for specificity, as it determines the probability of a person who does not have the disease, will test negative. The calculated value for this test is closer to 1.00. This means that there is a fair reliability in the PCR test to predict that the patient will not obtain the disease. There are a few errors found in this experiment that can negatively affect the results. Since the Bayes value is a result of frequencies, resulting from class data, the results can be slightly skewed. For example, not everyone in the class used the same smartphone, or even the same type, which can lead to variability in the pictures taken. There is also different levels of zoom to consider. With these issues, it is easy to see that the concentrations can be off, because of different sized drops found in the images, which can result in different INTDEN values, which can result in different concentration values. It is also easy to see that an increased sample size will result in more accurate data, but since some of the data could not be used, the sample size was decreased by about one third. This will cause the values to be in slightly more skewed fashion. Lastly, if certain groups took longer to prepare their samples for PCR in the PCR machine, some of the reagents could have started to denature as a result of being at room temperature for too long. If this was the case, the amount of DNA found in the tube after PCR would not be accurate, compared to what should be in the tube. In addition, preparing the tubes in a room such as done, provides an easy way for contaminants to get into the tubes. The only way to truly avoid this is to perform this preparation in a flow hood, but that is not feasible for a lab class of this size, such as this. Since these errors may or may not have happened in the groups, it is hard to tell how much the values obtained are affected, although it can be safely assumed that they were affected slightly.
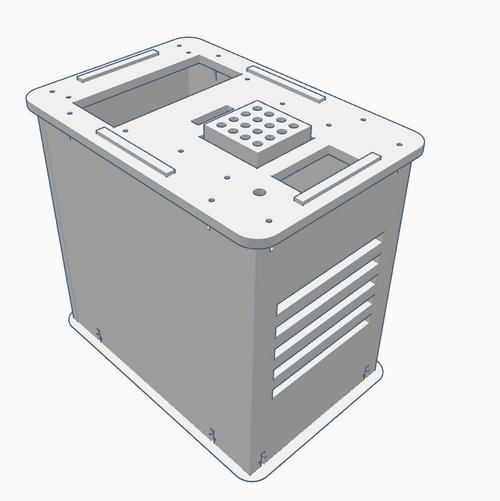
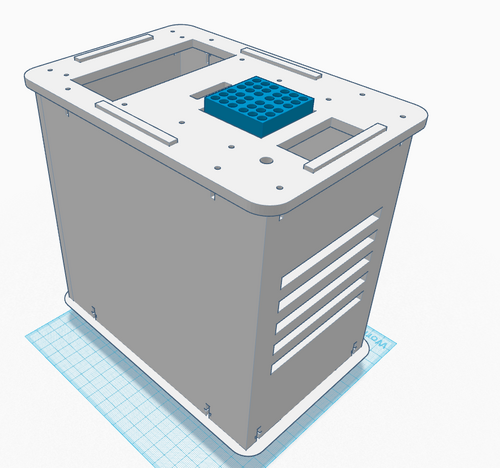
Computer-Aided DesignTinkerCAD Our Design Original PCR Machine: New PCR Machine (change shown in blue):
In the new PCR machine design, there are now 36 PCR micro-tube slots, compared to the previous number of 16 on the main heating block. To achieve this new design, two rows of micro-tube slots were added on each side, such that the 4X4 square became a 6X6 square. The reason for this change is because the PCR machine takes a long time to run, which can cause time-table problems if there are a lot of samples to be run. By increasing the capacity to 36, there are now 20 additional slots to fit in samples. To compensate for the slightly larger main heating block, a slightly larger hole on the top of the PCR machine is needed, along with a slightly larger cover.
Feature 1: Consumables KitThe consumable kit consists of PCR plates, tubes, seals, caps, and strips. This kit is key to ensuring optimal cycling performance in the real-time PCR machine. The components that the consumable kit is comprised of are economical and easy to use, as well as more or less durable. However, must be in good condition to house the DNA and reagents for accurate data. For this reason, the packaging must be readdressed. The main issue of packaging is the temperature and aggressive handling that can directly impact the effectiveness of the consumables kit. To address this issue, each component of the kit must be individually packaged, and the liquid reagents must be insulated in the packaging in order to prevent any issues that could arise from being exposed to high temperatures. The components of the consumables package must be packaged individually to prevent any damages that could arise during shipping. Though it would become more expensive to ship, the packages would be much more durable and there would be less damage to important pieces such as the PCR plate or strips. Additionally, the liquid reagents for the PCR have an ideal temperature range that it must be stored at to preserve the liquid. Ideally, the packaging for the reagents would be insulated in the package to prevent the temperature fluctuations of external environments to render the liquid reagents useless. The most affordable method of insulation for the liquid reagents during packaging would be styrofoam. By shipping these liquids in styrofoam, the impact of external factors on the package will be significantly reduced. Feature 2: Hardware - PCR Machine & FluorimeterPCR Machine: The PCR machine is very time consuming. With our new design you will be able to put more solution tubes into the machine in order to speed up the process of duplicating the DNA sequence Fluorimeter: The original fluorimeter design has a lid that is hard to close in a time efficient matter. Our design has a hinged lid that would make it easier to close the lid in time, before the smartphone beings to take the photo. Another change our team made to the original design of the fluorimeter is to the smartphone holder. The smartphone holder of the current fluorimeter makes it difficult to find a good placement of the smartphone. Our design would have an adjustable holder to adjust the size of the smartphone being used.
| ||||||||||||||||||||||||||||||||||||||||||||||||||||||||||||||||||||||||||||||||||||||||||||


