BME100 s2015:Group4 12pmL3
| Home People Lab Write-Up 1 | Lab Write-Up 2 | Lab Write-Up 3 Lab Write-Up 4 | Lab Write-Up 5 | Lab Write-Up 6 Course Logistics For Instructors Photos Wiki Editing Help | |||||||
|
OUR TEAM
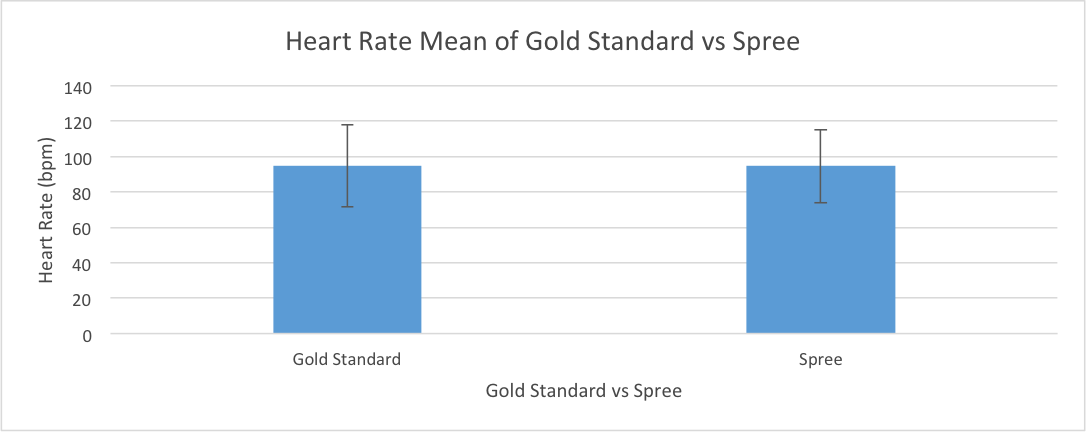
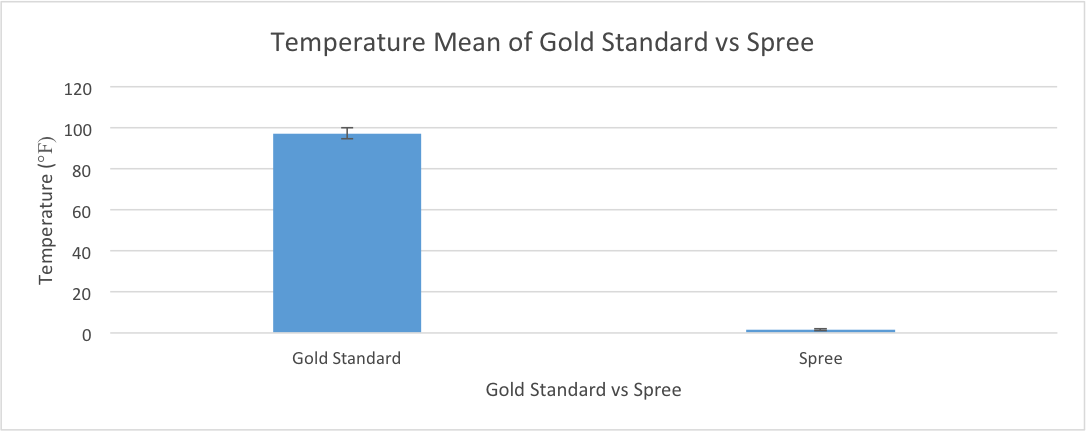
LAB 3A WRITE-UPDescriptive StatisticsAfter compiling all the heart rate and temperature data from all of the groups, it was found that the mean for the "gold standard" was 94.75 bpm and the mean for the Spree was 94.53 bpm. The standard deviations of the gold standard and spree were 23.11 and 20.61 respectively. In regards to temperature, the gold standard had a mean temperature of 97.33 degrees Fahrenheit and the Spree, which measured temperature in groups of 1-3, had a mean of 1.71. The standard deviations were 2.85 and 0.57 respectively. After finding these statistics a Pearson R and T-Test was conducted. The Pearson R showed a value of 0.567 for heart rate and -0.053 for temperature whereas the t-test found a value of 0.898 for heart rate and a value of 0 for temperature.
Results
Analysis
Summary/DiscussionIn conclusion, the spree had several flaws that make it unreliable as a heart rate and temperature monitor. The spree had a fairly accurate heart rate monitor, however, the temperature was presented as a color that was difficult to interpret and analyze. The spree also had a very weak bluetooth signal that could be overridden if there was another spree in the area. Additionally, it was difficult to access the data , as there was no means of recording data for later access. We believe that to improve the design of the spree, the effectiveness of the bluetooth must be strengthened and not disconnect if there is not enough movement. An improvement would be if there was an app for the spree that allowed the user to input a specific identification for their spree and connect to the spree's unique signal. The product should also come in a more appealing form. Though the spree is "hands-free" there is not much of an appeal to the forehead band. This design is not particularly convenient, and prone to external forces because of its lack of insulation. The sun, sweat, and wind are just a few factors that affect the spree's temperature gauge. To improve the spree it would be important to insure that the temperature can be read and interpreted by the average user, and that it is in a more convenient place like on the wrist or behind the ear. Overall, there are several design flaws that make the spree a poor product.
LAB 3B WRITE-UPTarget Population and Need1. The target population is for everyone that is 12 and older. This group of people can get the common cold, which is the problem. Everyone is prone to get the common cold, and this product will provide a way to counteract that. Although there is no cure for the common cold, these vitamins have reasonable evidence showing that they fight the virus. 2. As people have certain responsibilities such as jobs, people need to get over the common cold as quickly as possible. This patch will provide a quickened duration of the cold, as well in a reduction of common cold symptoms such as: coughing, congestion, sore throats, and headaches. 3. Problem Understanding Form
Device DesignThe patch has sticky part which adheres to skins. The patch is slightly thicker than the rest of the patch.
The slogan is: Peachy Patch, When Medicine Isn't Enough
Inferential StatisticsThe data set includes 30 patients who had the common cold. Separated into three groups, one given the peachy patch, one given Airborne, and given nothing (control). Averages and standard deviation already calculated.
An ANOVA test was run to see if there is significance between the three groups.
To show significance between Peachy Patch and the other two, two T-Tests were run.
This shows that the Peachy Patch had a significantly shorter cold duration compared to Airborne and the control in this test.
GraphThe graph represents the average time with the cold, with error bars representing the standard deviation values previously calculated.
|
|||||||


