BME100 s2015:Group3 9amL2
| Home People Lab Write-Up 1 | Lab Write-Up 2 | Lab Write-Up 3 Lab Write-Up 4 | Lab Write-Up 5 | Lab Write-Up 6 Course Logistics For Instructors Photos Wiki Editing Help | |||||
OUR TEAM
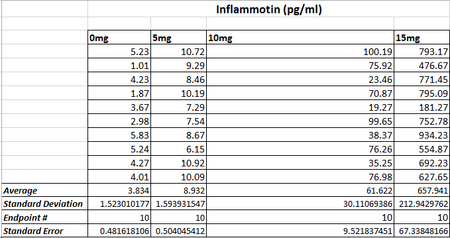
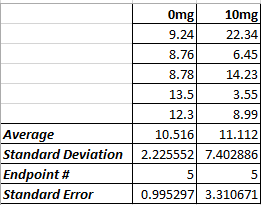
LAB 2 WRITE-UPDescriptive StatisticsExperiment 1 Experiment 2
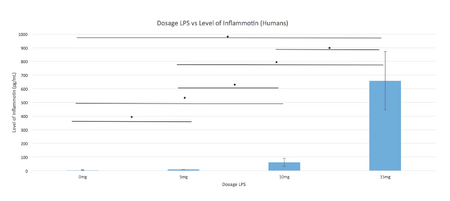
ResultsExperiment 1 ANOVA Test We used the ANOVA test for the human experiment, because there were more than two data sets to compare. Post hoc Tests
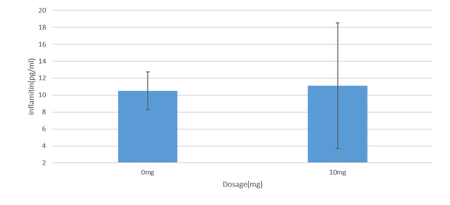
T Test We used a t test for the rat experiment, because there were only two data sets to compare.
AnalysisExperiment 1 According to the p-values for each of the post hoc tests, the individual p-values are significant. This is because the individual p-values were less than our calculated value of 0.0833. Since all of our values were significant, we can be sure that the data has value. Experiment 2 According to the t test, the p-value is not significant because it is greater than 0.05. This value was 0.867, meaning that we can be 86.7% sure that this experiment proved no significant data.
Summary/DiscussionThe data from both experiments show that the lipopolysaccharide significantly effected Inflammatin protein levels in humans but not rats. Furthermore, the p-values of the rat experiment show that the protein levels stayed the same between the 0mg and 10mg trials and no further experimentation was needed. On the other hand, the p-values from the human experiment show that the different dosages of lipopolysaccharide cause significant changes in human Inflammatin protein levels. We used post hoc tests to further compare the data from the ANOVA test, and we divided the original alpha value - 0.05 - by a value of six to account for the six comparisons (t tests) that we made. For Kirsten, we would advise her to use a more humanoid species for further experimentation such as apes. |
|||||


