BME100 s2015:Group3 12pmL3
| Home People Lab Write-Up 1 | Lab Write-Up 2 | Lab Write-Up 3 Lab Write-Up 4 | Lab Write-Up 5 | Lab Write-Up 6 Course Logistics For Instructors Photos Wiki Editing Help | |||||||
|
OUR TEAM
LAB 3A WRITE-UPDescriptive Statistics
Results
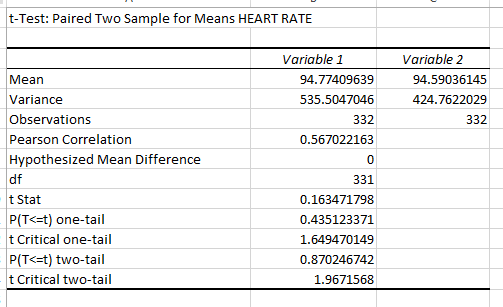
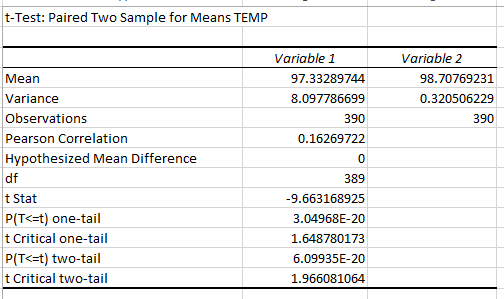
AnalysisThe Pearson Correlation for heart rate showed to be 0.567022163 which shows that there is a positive slope. Due to the correlation being .5, there is a modest correlation between the Gold Standard and Spree. The Pearson Correlation for temperature showed to be 0.16269722 which shows that there is a positive slope also. Due to the correlation being .16, there is zero to low correlation between the Gold Standard and Spree. The t-test for Heart Rate was 0.870246742. This shows there is similarity between the data and results in high accuracy. The t-test for Temperature was 6.09935E-20. This shows there are large differences between the data and results in low accuracy.
Summary/DiscussionDuring the statistical analysis of the average heart rate and temperature within all of the groups we discovered that the heart rate was accurately measured by the Spree. The t-test determined that there is no statistical difference between the control and the Spree, while it did not accurately measure temperature due to the t-value being lower than 0.05. The t-value lower than 0.05 shows that they are statistically different. On the other hand, the t-value for heart rate showed a value extremely greater than 0.05 which shows that there is a large similarity within the statistical analysis and in turn shows that the product accurately measures heart rate. After review of the Spree product, we determined that there was definite accurate measurement of Heart Rate but not Temperature. The Spree product, therefor would be useful and beneficial to anyone looking to purchase a product that would measure and track heart rate but not for someone who is looking to regulate their temperature.
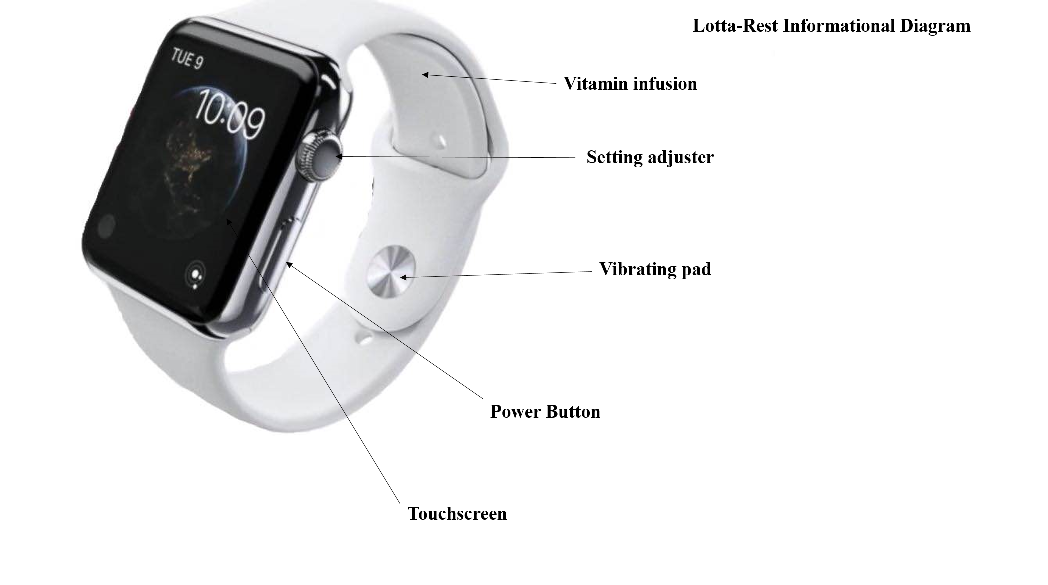
LAB 3B WRITE-UPTarget Population and NeedThe target population for the Lotta Rest watch is going to be students beginning their second semester of college including those who are deaf or have hearing problems. The students will have a current GPA of 2.5 prior to the sleep watch. The population will consist of 50 subjects who wear the watch and 50 subjects who do not. The students will then be monitored over a semester of similar academics. The Lotta-Rest sleep enhancing watch satisfies many needs of the target consumer by being low-cost, having an unusually long battery life and having a comfortable design. The watch monitors your different stages of sleep to leave you feeling well rested and ready for a long day. Having more sleep tends to improve most student’s grades. The watch provides a light weight and easily usable design. It very accurately calculates the amount of sleep and stages of sleep, to be able to improve the rest of the user. It also provides a regular infusion of vitamins to improve the user’s health.
Device Design
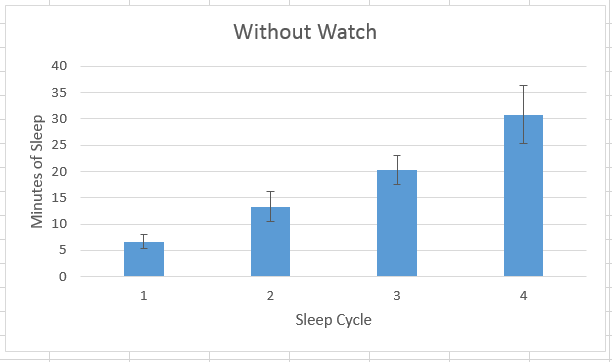
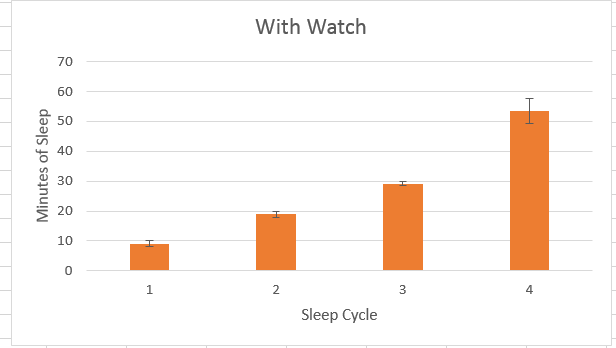
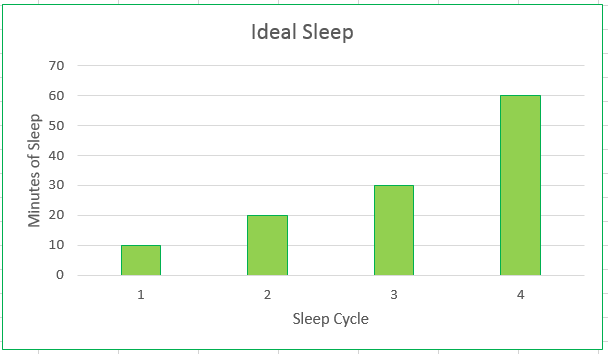
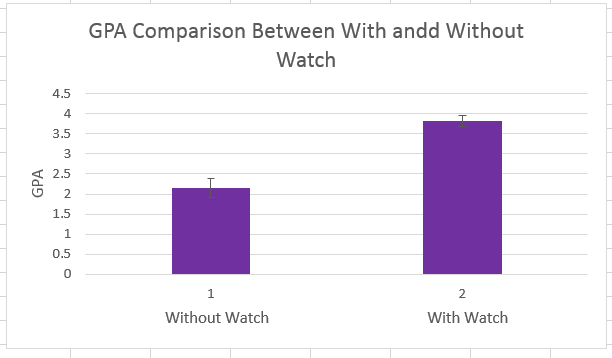
Inferential Statistics100 college studens were tested. 50 with the watch. 50 without the watch. Both groups came in with poor amounts of sleep and a GPA average between 1.5 to 2.5 (similar to the results of the people who did not wear the Lotta-Rest sleeping watch). These are the average results of each group after an entire semester of observation. Sleep stages: without the watch- Average: 1- 6.655 minutes, 2- 13.295 minutes, 3- 20.295 minutes, 4- 30.355 minutes Standard Deviation: 1- 1.37438, 2- 2.82684, 3- 2.82684, 4- 4.5433 Sleep stages: with the watch- Average: 1- 9.035 minutes, 2- 18.88 minutes, 3- 29.13 minutes, 4- 53.57 minutes Standard Deviation: 1- 0.99856, 2- 0.87756, 3- 0.7027, 4- 4.12363 T-test between cycles: 1- 2.464E-07, 2- 3.059E-10, 3- 3.83E-16, 4- 2.768E-19 Since each value of the t-tests are all lower than 0.05, the amount of sleep is different depending on whether the subject wears the watch. Grade Point Average: Without Watch: Average: 2.15, Standard Deviation: 0.247243 With Watch: Average: 3.83, Standard Deviation: 0.13409 T-test: 3.4253E-26 The t-test value shows that the GPA between the two groups are different. It appears from this data that the Lotta-Rest sleeping watch does in fact improve sleep and grades.
Graph
|
|||||||


