BME100 s2015:Group3 12pmL2
| Home People Lab Write-Up 1 | Lab Write-Up 2 | Lab Write-Up 3 Lab Write-Up 4 | Lab Write-Up 5 | Lab Write-Up 6 Course Logistics For Instructors Photos Wiki Editing Help | ||
OUR TEAM
LAB 2 WRITE-UPDescriptive Statistics
Results
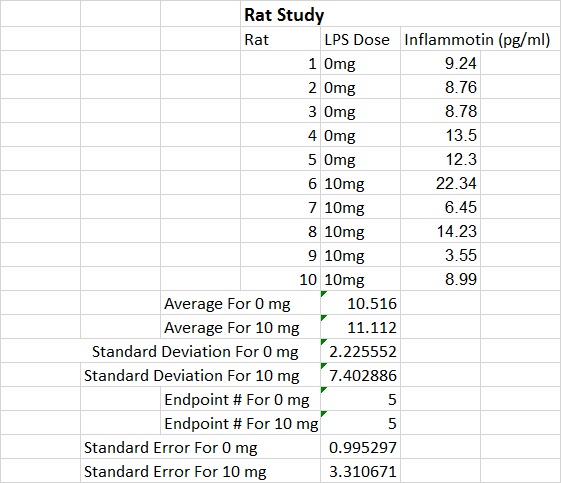
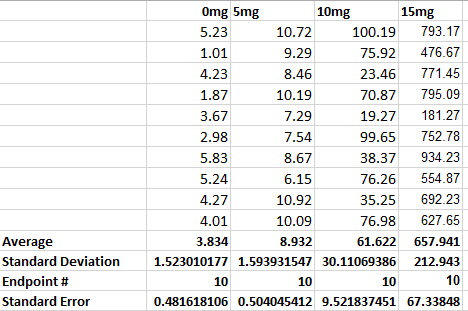
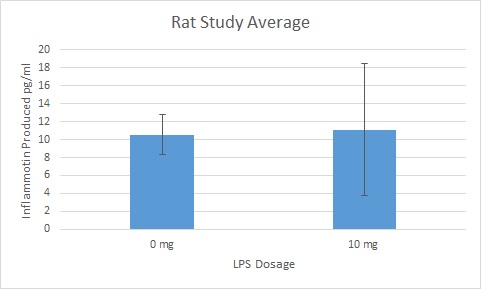
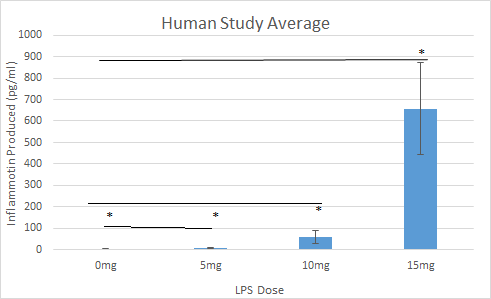
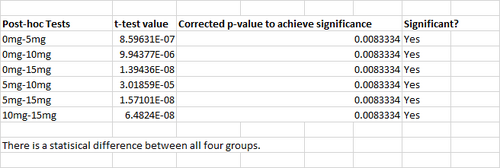
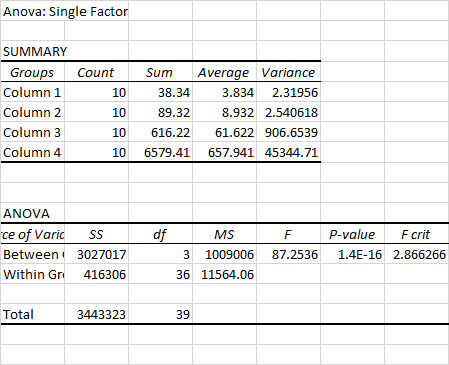
AnalysisSummary/DiscussionIn experiment number 1, the Rat Experiment, 1 group consisting of 5 rats was given 10 mg of LPS and compared to a control group of another 5 rats that was not given any medication. The average level of production of Inflammotin for the medicated group was 10.516 pg/ml and the average for the natural producing group was 11.112 pg/ml of Inflammotin. One can see that these level of production are very similar to one another. Once the T- Test was performed which yielded a result of 0.867. Since it was higher than the standard of 0.05 this leads to the conclusion that there is no significant statistical significance between the results of the 2 groups. In experiment 2, the Human Experiment, there were four different LPS dosages given to four different groups to test how effective each dosage is. The final result was that each dosage was in fact different from each other. We had to use a t-test and an ANOVA variance to distinguish between the four dependent variables. One way to double-check the difference between each dosage is whether or not the standard deviations overlap. In the chart above, the standard deviation do not overlap indicating that the groups are different from each other. We can conclude from these two experiments that the LPS dosage has a much bigger impact on humans than it does on rats. |
||

