BME100 s2015:Group2 9amL2
| Home People Lab Write-Up 1 | Lab Write-Up 2 | Lab Write-Up 3 Lab Write-Up 4 | Lab Write-Up 5 | Lab Write-Up 6 Course Logistics For Instructors Photos Wiki Editing Help | ||||||
OUR TEAM
LAB 2 WRITE-UPDescriptive StatisticsExperiment 1 (Humans) Experiment 2 (Rats)
ResultsExperiment 1 (Humans)
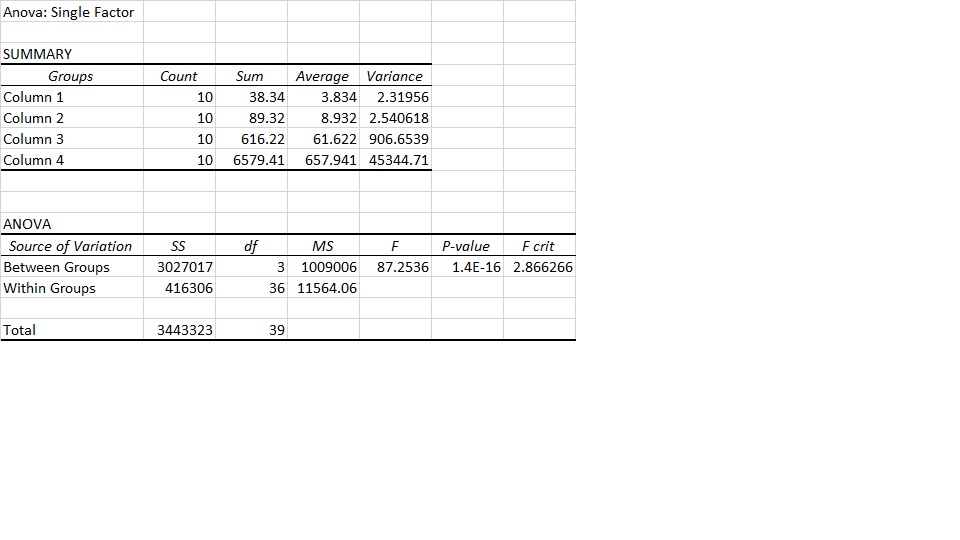
AnalysisExperiment 1
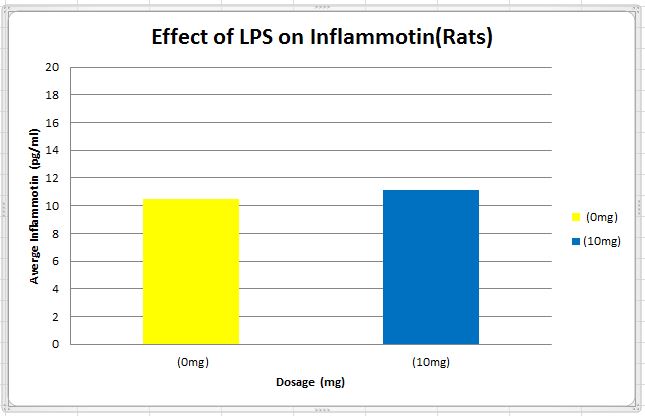
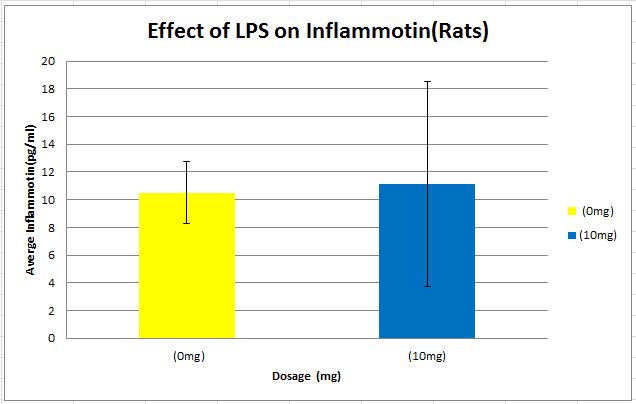
Experiment 2 The T-test performed between the two rat groups. They results didn't yield a P-Value less than 0.05, meaning that there is no significant difference between the two groups. The final analysis of experiment two was that the production of the protein inflammotin within rats via LPS treatment can not be determined to be effective with the data form the experiment.
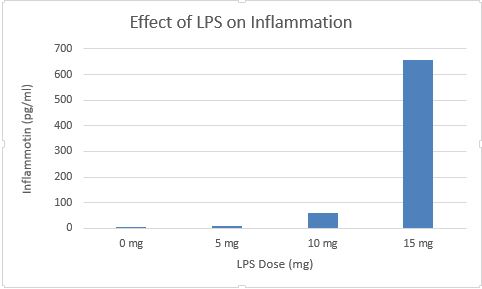
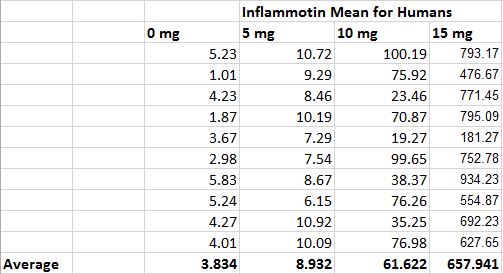
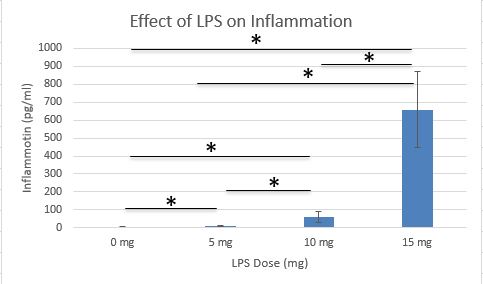
Summary/DiscussionFor Experiment 1, on humans, Inflammotin increases significantly with each increased dosage of LPS. This is demonstrated by the calculated t-test value being less than the corrected p-value. The correct p-value was calculated by taking the standard p-value, 0.05, and dividing it by six, the number of comparisons made between dosages. An ANOVA was used to compare the data because there were more than two groups being compared. For Experiment 2, on rats, Inflammotin did not show any significant increase with increased dosages of LPS. The calculated t-test value was greater than the standard p-value (which was used because only one comparison was made between two groups). A t-test was used because only one comparison was being made between two groups. Possibilities of lack of increase of Inflammotin include the LPS not having the same effective on rats as it does on humans. |
||||||


