BME100 s2015:Group2 12pmL2
| Home People Lab Write-Up 1 | Lab Write-Up 2 | Lab Write-Up 3 Lab Write-Up 4 | Lab Write-Up 5 | Lab Write-Up 6 Course Logistics For Instructors Photos Wiki Editing Help | |||||||
OUR TEAM
LAB 2 WRITE-UPDescriptive Statistics
Results
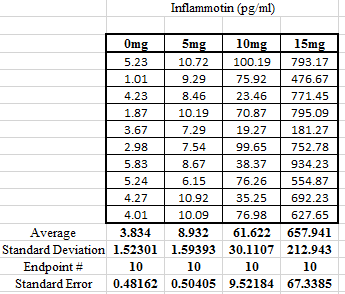
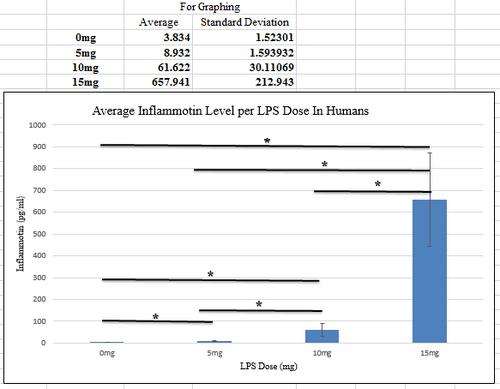
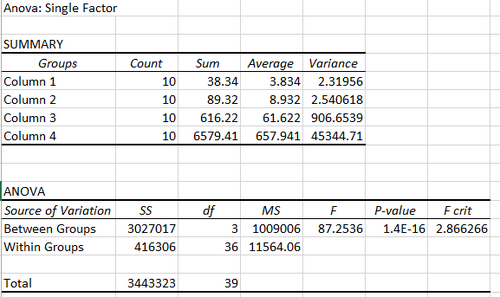
AnalysisFor the study with Humans, the ANOVA test was used because there were more than 2 data sets to be compared. Then, the Bonferoni Correction test was used by implementing the t-test to find the corrective p-value for each of the comparisons (example: 0mg vs. 5mg and 0mg vs. 10mg). There were six comparisons total which were based off of the four different groups. These values were used to determine the significance between the the p-value of 0.0083 (0.05 divided by 6) with the t-test value for each of the 6 comparisons. The values were deemed significant because of the great differences between the T-Test Value and the corrected P-Value.
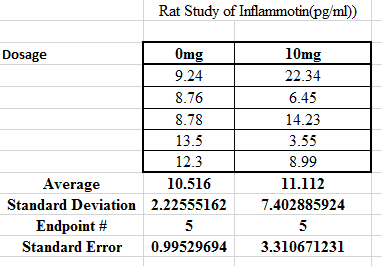
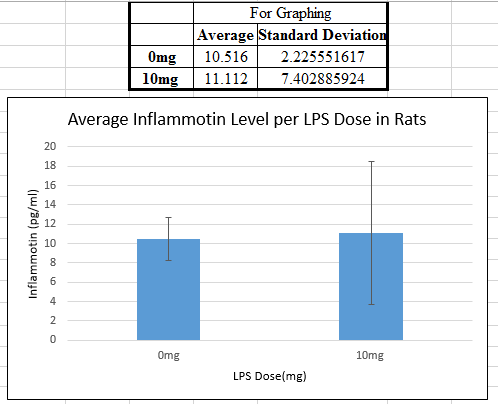
During the rat study, the dosage of 0mg changed the amounts of Inflammotin within the rats to a very equal amount compared to the Inflammotin levels within rats who took a 10 mg doage. The averages were 10.516 for 0mg and 11.112 for 10mg; the deviation between these two appears very small especially when compared to the 0 and 10 mg dosage effects on humans. The standard deviation within these two groups of rats also caused some of this apparent lack of significance (the 10 mg group had a very large standard deviation). A T-Test was ran and the results of the T-Test yielded the data statistically insignificant. This means that the difference between the two groups is insignificant according to statistics. This could possibly be credited to the large standard deviation in the rat groups; this standard deviation shows that the level of Inflammotin within the test subjects of the 0mg and 10mg groups varied drastically.
Summary/DiscussionFor the experiment regarding the presence of Inflammotin in rats, the T-Test was used to analyze the data. The T-test was chosen because the rats experiment only included two data sets-so ANOVA was not necessary. In the Rat test, there was no significant statistical difference, and so there was no importance in the difference between 0mg and 10mg dosage levels in rats. However, in the human study where 0, 5, 10, 15 mg were used there was a significant difference between each of the 4 doses. Due to the fact that there were 4 groups, the ANOVA test had to be ran in order to check the difference between the groups. A post-hoc test was then deemed necessary in order to draw comparison between each separate group(0mg vs. 5mg, 5mg vs. 10 mg, etc). The post-hoc test utilized the Bonferroni correction factor in order to see if the difference between the groups was significant or not. Every group yielded that there was significant variance after accounting for the Bonferroni correction and then running T-Tests between each comparison. These two studies appeared to be linked through the different effects which LPS has on the Inflammotin levels in people versus rats. In rats, the LPS drug did not have a significant impact on the Inflammotin levels. A dosage of 10 mg hardly affected the rats at all. However, with people, the levels of Inflammotin increased as dosage increased. If a 0 mg and 10 mg dose are compared in humans versus rats - humans have large levels of Inflammotin while rats have a fairly consistent level. The LPS drug does not seem to have a considerable effect on rats, whereas, in humans, the drug increases Inflammotin levels rather rapidly. |
|||||||


