BME100 s2015:Group1 9amL2
| Home People Lab Write-Up 1 | Lab Write-Up 2 | Lab Write-Up 3 Lab Write-Up 4 | Lab Write-Up 5 | Lab Write-Up 6 Course Logistics For Instructors Photos Wiki Editing Help | ||||||
OUR TEAM
LAB 2 WRITE-UPDescriptive StatisticsExperiment 1
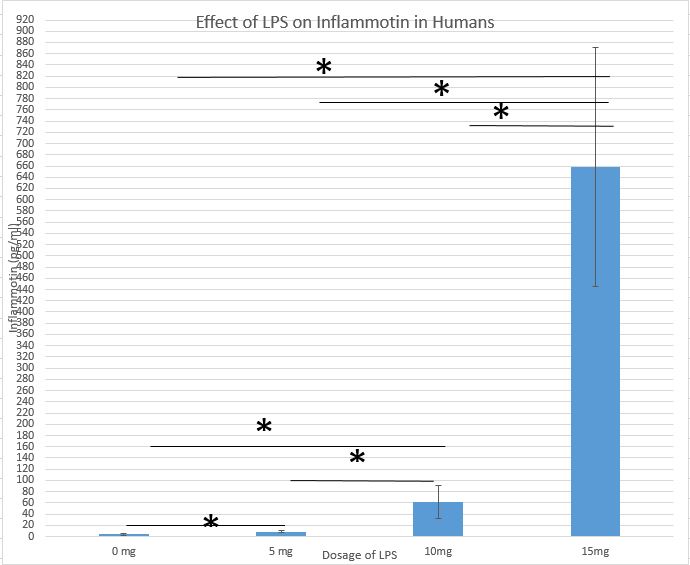
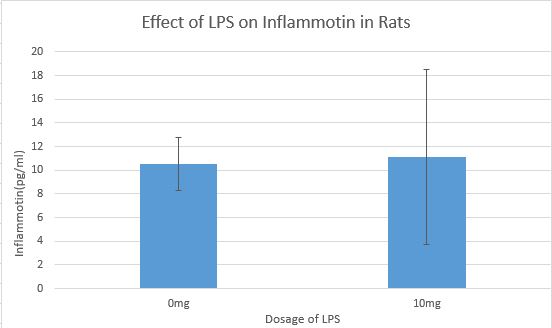
ResultsExperiment 2
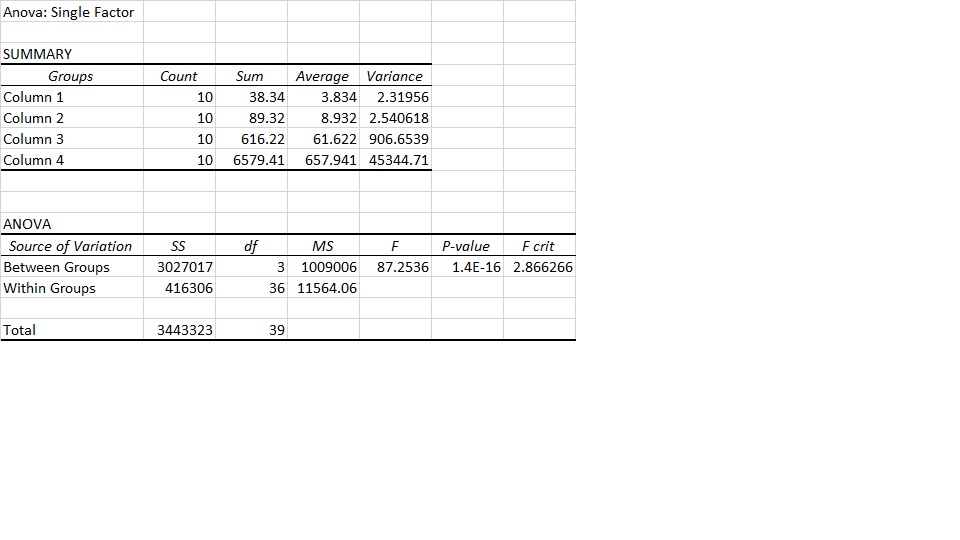
AnalysisExperiment 1
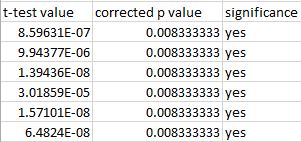
Every t-test of each relationship resulted in a value that was less than the corrected P-value. This shows there was a significance between each group.
Summary/DiscussionIn experiment 1, based on the data collected, all of the groups were significant to each other. In experiment 2, based on the data collected, all of the groups were insignificant to each other. We divided by 6 because there were 6 comparisons total. The study cannot be used with rats because the data was insignificant. Ideal subjects for this study would be humans as the Anova test revealed that the data for humans was significant. There was a strong correlation between inflammotin and LPS doses that was not seen in the rat data. There could be multiple factors for why the rat data was insignificant such as health/condition/age of the rats.
Upon further analyzation of the data from the human and rat experiments it can be concluded that the two experiments are actually linked to each other even though the human experiment was significant and the rat experiment was insignificant. The way that the two experiments is that the test subjects in both the experiments had varying levels of inflammotin in both those that did not receive LPS and those that did receive a dosage of LPS. |
||||||


