BME100 s2015:Group16 12pmL6
| Home People Lab Write-Up 1 | Lab Write-Up 2 | Lab Write-Up 3 Lab Write-Up 4 | Lab Write-Up 5 | Lab Write-Up 6 Course Logistics For Instructors Photos Wiki Editing Help | ||||||
|
OUR COMPANY
LAB 6 WRITE-UPBayesian StatisticsOverview of the Original Diagnosis System For this experiment, patients were tested for the disease-associate SNP using PCR methods. The results from this test was accumulated from 26 BME100 groups of 5 students who diagnosed a total of 52 patients. Several steps were taken to prevent error in the results. Regarding the PCR section of the experiment, 3 replicate samples of each patient were used in order to account for error during the lab. Since each patient had 3 samples that were processed in the PCR lab the error for the results should be decreased because if one sample is inaccurate, there are two other viable samples. PCR positive and negative controls also help prevent errors by providing a comparison sample for the patients sample. The numbers from the results of these base samples are used to determine if a sample is positive or negative.To prevent error in the ImageJ calculations, 3 drop images per PCR sample were used for calculations and the mean of the three images was calculated for each individual sample. Averaging the three images will decrease the error that can occur between drop images. Calibration controls for ImageJ were also used as comparison to the other sample concentrations in order to assure that the correct results were given. After examining the final data for the BME100 PCR results, there were 22 successful conclusions from the lab meaning that the calculated results and actual results matched each other for each patient. There were some inconclusive results, however, we disregarded them because they do not give a definitive result. There were also some blank data in which the group did not perform a PCR diagnosis to determine if the PCR samples were positive or negative. Several results were not included in the final data due to their inaccurate calculations and final results. What Bayes Statistics Imply about This Diagnostic Approach
Calculation 2 results: The Bayes value for calculation 2 is close to 1.00 meaning that the individual PCR replicates for concluding whether or not a person has the disease SNP is reliable.
Calculations 4 results: The Bayes value for calculation 4 is close to 1.00 meaning that using PCR for predicting the development of the disease, diagnosis, is reliable. Computer-Aided DesignTinkerCAD To create our new device PCR device the TinkerCAD software was used. TinkerCAD is a online 3D modeling program that allows anyone to design semi-complex objects wit pre-built parts or by importing parts. While not as complex and comprehensive as as programs such as Solid Works it does allow anyone the ability to freely design the look of an object in three dimensions. For our Design lab TinkerCAD was used to assemble the Open PCR device and then construct changes to the device after determining what changes need to be made to improve the device. Our Design
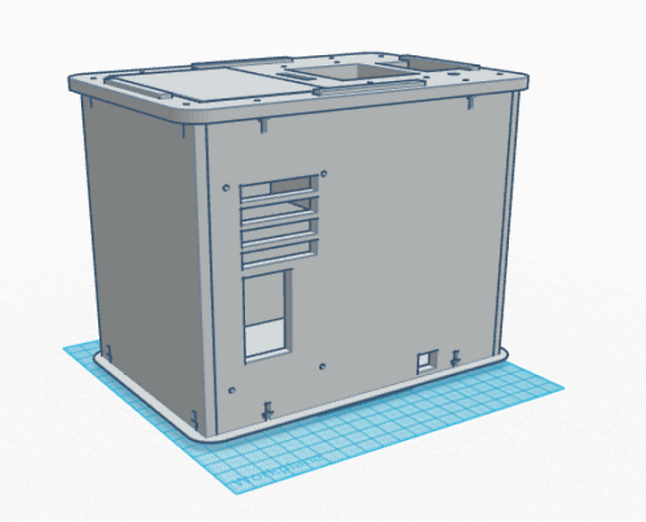
Side View: There are a couple changes to our design that are visible in the designs displayed above. The first is that the the PCR machine is notable shorter. This was done so that the device will be more portable compared to the previous device. Another visible change is that a larger display screen has been added to the device. This will allow the machine to be programmed and PCR to be run without needing to be plugged into a computer. This will also increase the portability of the device as it does not need to be by a computer to operate. The other visible change to the PCR machine is that the slot for the test tubes has been made larger in all directions. This will allow up to 20 test tubes to be placed in the machine at a time. The increase in compartment size will also allow larger test tubes to be placed in the machine producing more DNA during replication.
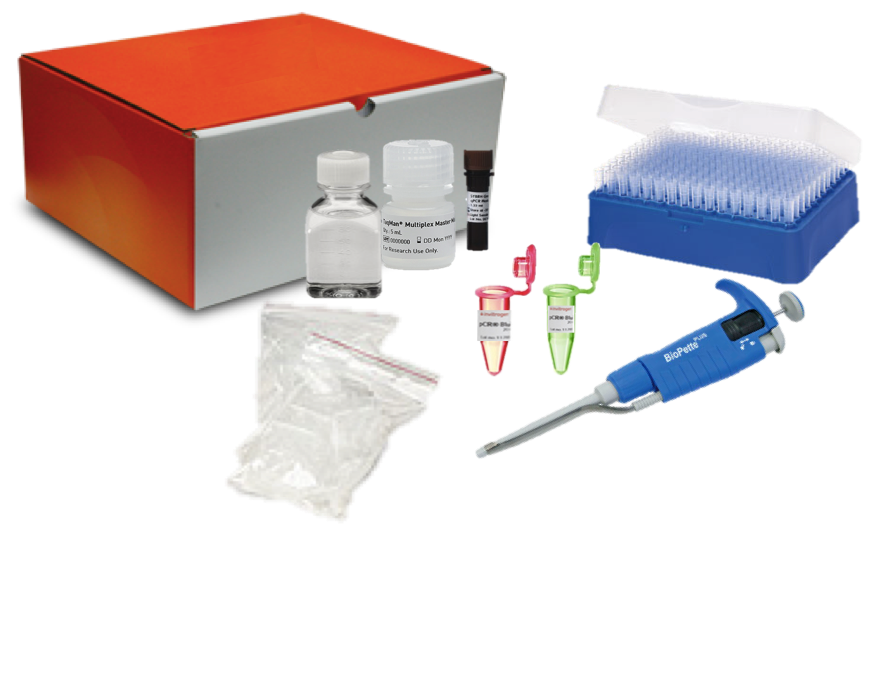
Feature 1: Consumables Kit
Feature 2: Hardware - PCR Machine & FluorimeterThe PCR machine and fluorimeter will come as they did before. The packaging for the PCR machine packaging will be smaller although because we have designed our new PCR machine to be smaller and more portable. The fluorimeter packaging will be slightly bigger because of an additional camera that is being added. Both packaging will come with more insulation to protect the devices as the fluorimeter will now contain a sensitive camera that needs to be protected and adding additional insulation to the PCR machine will allow it to be transported to remote areas while taking less damage making it more portable.
A major weakness found with current OpenPCR machine is the portability. As it stands, the machine requires an outlet for a power source, and it must be attached to a computer with the software to control the machine. With this redesign, the PCR machine will have a battery pack, an onboard computer, and it will also be smaller. This addition of an onboard computer allows the user to control or adjust the software of the machine, eliminating the reliance on separate computers. In addition to the computer, a battery pack will be added, allowing the machine to be taken to remote areas. A decrease in size of the PCR machine will allow these machines to be transported in greater quantities, making it cheaper as well as more manageable.
| ||||||


