BME100 s2015:Group14 12pmL3
| Home People Lab Write-Up 1 | Lab Write-Up 2 | Lab Write-Up 3 Lab Write-Up 4 | Lab Write-Up 5 | Lab Write-Up 6 Course Logistics For Instructors Photos Wiki Editing Help | ||||||
|
OUR TEAM
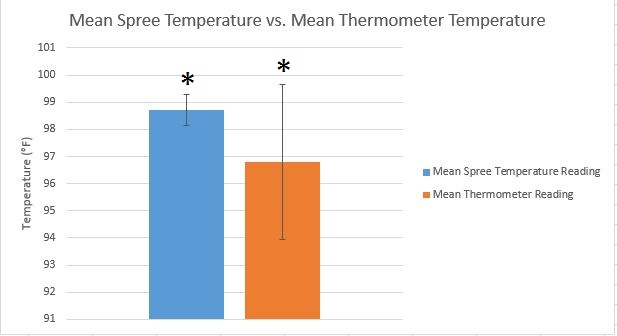
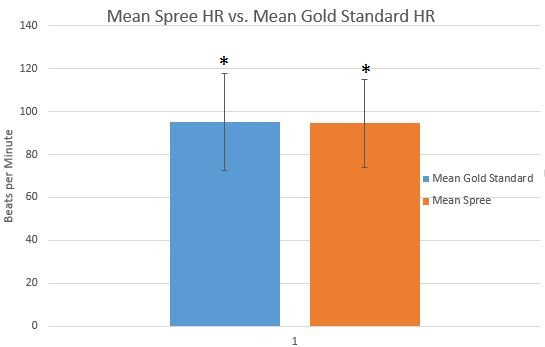
LAB 3A WRITE-UPDescriptive StatisticsTemperature -Mean of Spree = 98.71 degrees F -Mean of Thermometer = 96.8 degrees F -Standard Deviation of Spree = 0.5661 degrees F -Standard Deviation of Thermometer = 2.8457 degrees F Heart Rate -Mean of Spree = 94.52 bpm -Mean of Gold Standard = 95.27 bpm -Standard Deviation of Spree = 20.653 bpm -Standard Deviation of Gold Standard = 22.503 bpm
Results*
Measurements are significantly different from one another.
AnalysisInferential Statistics Temperature: T-Test p value: 1.3607*10^-18 Pearson's R = -0.0530722 Heart Rate: T-Test p value: 0.494561 Pearson's R = 0.576208 Interpretation of Results There is significant difference between the two measurements of temperature according to the t-test p value. There is little to no correlation between these two because of the R value almost equal to zero. When looking at the t-test results, there is no significant difference between the two according to the p value. However, there is significant difference in the two measurements of heart rate for Pearson's R.
Summary/DiscussionThe overall design of the Spree headband is a decent attempt at a cutting edge device in the fitness monitoring field. However, there are many flaws in the design that need to be addressed to improve overall performance. In terms of actual performance, the Spree is not a useful device. Using T-test statistics, as well as linear analysis, there is no significant correlation between the Spree's heart rate and temperature monitoring capabilities and those of standard devices. This renders the device useless for accurate body monitoring. As for ease-of-use, there are three major issues. First,the headband does not comfortably fit around the head, as wearing the product became painful and uncomfortable after a short time. This makes the device less desirable to consumers. Second, the app that goes along with the device is not user friendly in terms of initial setup and use. There is no clear indication that the smart-phone and headband are in sync with one other. Third, the Spree app constantly drains battery life from the smart-phone, as well as takes up a lot of data space on the phone since workout history cannot be deleted. Some recommended design changes that could improve the overall quality of the Spree include making the device more aesthetically pleasing, removing the hard plastic on the side of the headband to decrease wearer discomfort, adding accurate sensors for heart rate and body temperature, and redeveloping the app to reflect more accurate measurements, as well as to measure information including distance traveled and calories burned. In general, the device needs improvements before it should be marketed to the public.
LAB 3B WRITE-UPTarget Population and NeedTarget Population: -Paralyzed (~9 million in the U.S.) -Spinal Cord Injuries (250,000 in the U.S.) -Paraplegics -Quadriplegics ◾Average lifetime costs for paraplegics, age of injury 25: $428,000 ◾Average lifetime costs for quadriplegics, age of injury 25: $1.35 million Need: People who have sustained paralyzing injuries can live easier with restoration of their muscle capabilities. The overall personal and financial burden of care can be reduced if muscle function can be restored. Therefore, a device is needed to address these issues. Problem Understanding Form
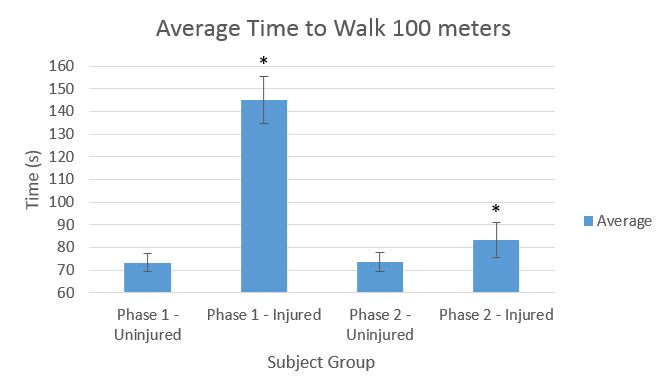
Device DesignInferential StatisticsFor a 2 phase study consisting of uninjured and injured subjects, the differences in times for walking 100 m were recorded. Both groups wore the device during each phase. A p-value of .05 was required to indicate statistical significance. Comparing injured group in Phase 1 to same group in Phase 2: T-test p-value: 3.17E-28 Comparing uninjured group in Phase 1 to same group in Phase 2: T-test p-value: 0.840
Graph* Indicates significant difference.
|
||||||


