BME100 s2015:Group10 12pmL6
| Home People Lab Write-Up 1 | Lab Write-Up 2 | Lab Write-Up 3 Lab Write-Up 4 | Lab Write-Up 5 | Lab Write-Up 6 Course Logistics For Instructors Photos Wiki Editing Help | |||||
|
OUR COMPANY
LAB 6 WRITE-UPBayesian StatisticsOverview of the Original Diagnosis System Each of the 34 teams took 2 patients samples to screen for the presence of the disease associated gene. Using open PCR, we amplified the DNA samples using a primer we designed to capture this specific SNP. We used 3 different samples of each patient's DNA, along with a positive and negative control. First, we created calibration samples with a known concentration of SYBR green and DNA, which we dropped on the slides and shined a light through to capture with our camera. Using these known concentrations, we imported these labelled images into imageJ for analysis. To ensure a more accurate result, we took three images of each drop, and averaged the resulting values. By taking a measure of the intensity, offset for the background 'noise', we were able to graph various points of intensity reading of the imageJ file vs known concentration of DNA. At this point we could create a linear fit the the collected data points and obtain a method of determining the approximate DNA concentrations by simply analyzing the intensity of the picture of the sample in imageJ. Once we had the calibration curve, we obtained the patient samples and took pictures of them on the lighted slides. By using our calibration curves, we translated the analyzed patient image data to the DNA concentrations. By comparing the DNA concentrations to the positive and negative controls, we were able to ascertain whether or not our test had indicated a positive reading for the disease associated gene. To minimize error, we took three images and averaged the data> As for the patient samples, we took 3 pictures of each sample, and used 3 samples fro each patient, totaling 9 picutres per patient. By using their average, we ensured a more accurate result. As a whole class, many groups yielded many true positives and true negatives from their tests, indicating that on average, our screening method was fairly accurate. What Bayes Statistics Imply about This Diagnostic Approach
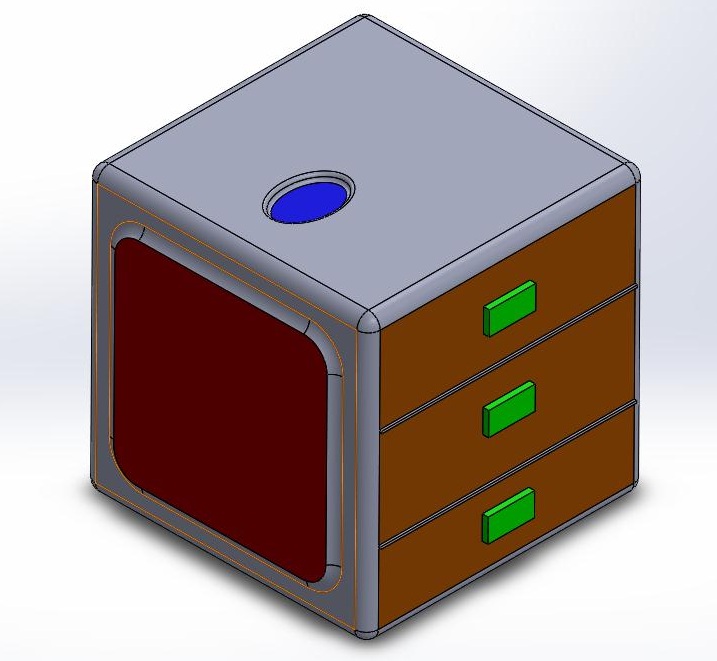
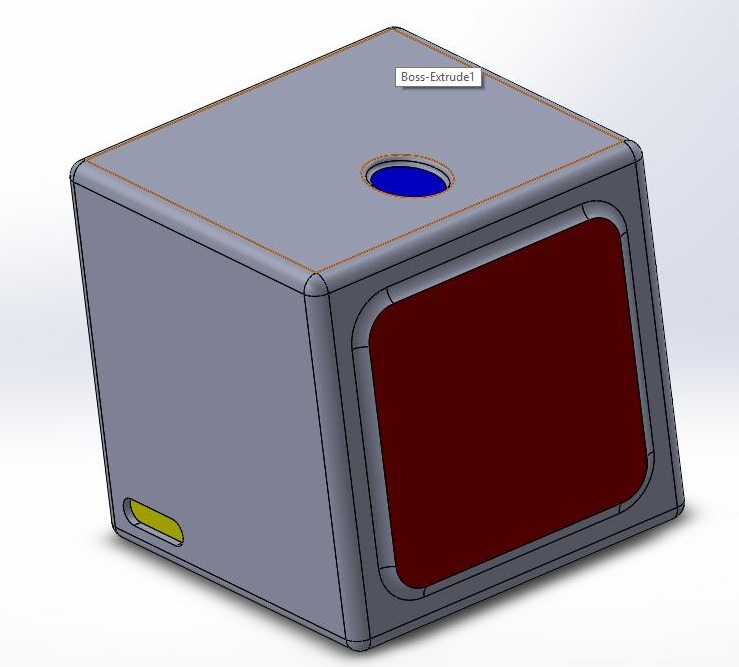
Again, based on our numbers, if they come positive on the test, then they are true positives and have the disease. Since the statistics gave a value relatively close to one, we can say that the test does a good job of diagnosing a disease based on the Open PCR and SYBR Green flourimeter method. Given the presence or absence of the SNP we can predict what the test will yield. Addotionally, the Bayesian statistics allow us to reverse those results, and look at the positive or negative results of the test and translate those into the prediction of the presence of the disease SNP. Computer-Aided DesignTinkerCAD able to explain them. First the blue eclipse on the top of the cube is the finger blood pad that quickly pricks your finger and takes the blood of the patient and extracts the DNA. On the right side of the picture are three orange doors with green clickers to open them. These drawers hold the different compartments of the PCR Machine and allow for the removal of waste and the insertion of replacement consumables. The front holds the red screen which is the touch screen of the PCR Machine that enables the person to be able to make commands to the PCR and display messages to the user. The left yellow oval is where the power chord is magnetically attached. We used Solid Works instead of tinker cad. Having previous experience was helpful, and led to a more user friendly experience. I first started with the box frame which was made in the figure of a cube. The red touch screen was made and then the blue ellipse was second on top. The drawers of the PCR Machine next had to be made which was made by making three rectangles and extruding them slightly. The Green clickers were put in the middle of the three boxes that would enable for the boxes to open. On the left side of the box in the corner is a yellow oval intruded into the box which was created as the charger importer.
it. We then made an easy device on the top of the box to extract the blood of patient. We then decided to create drawers that would be able to make it more accessible to the consumables and the waste after a trial.
Feature 1: Consumables KitOur consumables package will include pipette tips, two micropipettors, and the reagents (PCR, primers). The two micripipettors will allow users to work in teams if they desire. The non-reusable tips will be available for repurchase after the ones in the original kit are used up. There will be packets available from 100 tips up to 1000. This is convenient for those who have a small lab as well. The kit will be packaged in a sealed, sterile container to avoid any contamination. The replacement for the kit's parts will be relatively inexpensive. We will also include a DVD with step-by-step visual instructions for first-time users of a PCR machine, explaining the importance of labeling and avoiding cross-contamination, among other things. Feature 2: Hardware - PCR Machine & FluorimeterOur PCR machine will do all of the work inside of it. It will have three floors within it where the process can be done automatically, or if the user prefers it, some parts may be done by the machine and others by hand.
The first floor will include a place where the user can place a DNA sample. They the machine will begin the PCR by using the reagents of the user's choice. The touch screen menu presentation at the front of the PCR machine gives the user the choice to watch the process and select the number of samples it wants. The next floor will remove impurities and make sure the samples are ready to be tested. On the bottom floor, there will be a camera, which will analyze images. The built-in fluorimeter makes it easier for the users to get more accurate data. This removes any chances or cross-contamination problems or human errors. The machine may also be programmed to send the data results instantly via a wireless network. This machine is more efficient, faster and more user friendly than the original PCR machine.
| |||||


