BME100 s2015:Group10 12pmL2
| Home People Lab Write-Up 1 | Lab Write-Up 2 | Lab Write-Up 3 Lab Write-Up 4 | Lab Write-Up 5 | Lab Write-Up 6 Course Logistics For Instructors Photos Wiki Editing Help | |||||
OUR TEAM
LAB 2 WRITE-UPDescriptive StatisticsExperiment 1
Experiment 2
ResultsExperiment 1 Experiment 2
AnalysisExperiment 1
Source of Variation SS - df MSF P-value F crit Between Groups 3027016.695 3 1009005.565 87.25360195 1.40083E-16 2.866265551 Within Groups 416306.0267 36 11564.0563
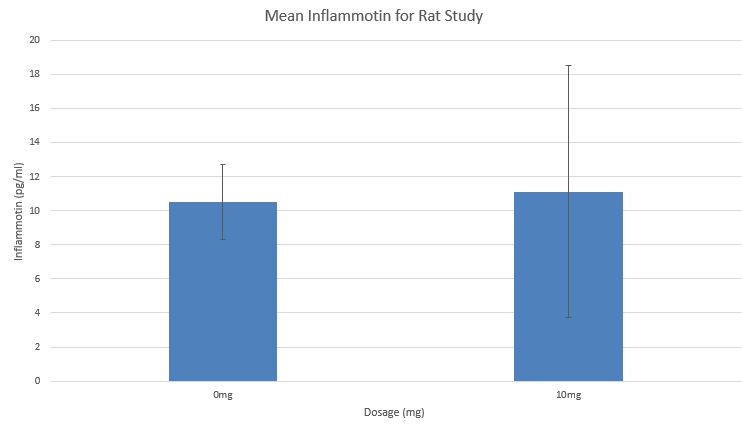
Total 3443322.721 39 _____________________________________________________________________________________________________________ Experiment 2 T-Test(Rats) - 0.867403497 The p-value was much greater than .05, therefore not statistically significantly different.
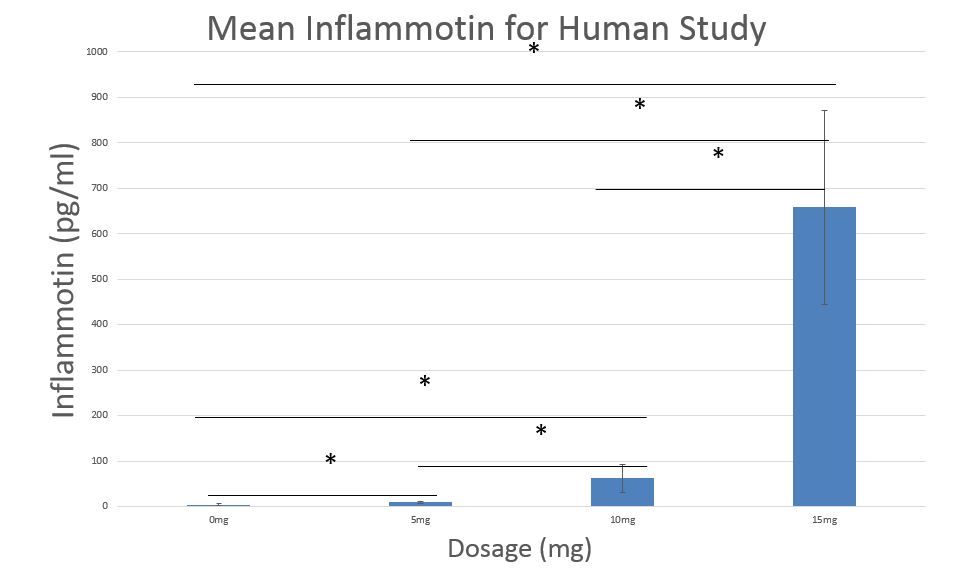
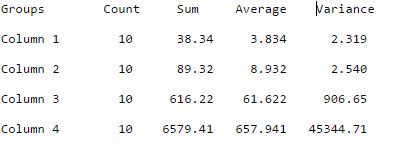
Summary/DiscussionIn experiment number 1, human test subjects were given different dosages of LPS between 0-15mg in increments of 5mg. There were ten human test subjects per group. The results show that there is a significant difference between the Inflammotin protein levels between the test subjects. This was tested by contrasting the t-test between each possible pair of dosage (i.e: 0-5mg, 0-15mg). We also conducted an ANOVA test on the human results and found again that the results had a significant difference between the Inflammotin protein levels. In experiment number 2, rat test subjects were given two different dosages of LPS, one group of five rats were given 0mg and the other five rats were given 10mg. The results of the t-test showed that there was not a significant difference of inflammotin protein levels between the two groups. There was a larger sample size in the humans than the rats which could have altered the results. With a greater sample size of rats we could have had a more accurate representation of the effect on rats. Based on both the ANOVA and the t-test we were able to conclude with statistical certainty that humans had a more reliable positive correlation with LPS than the rats. |
|||||


