BME100 f2013:W900 Group9 L3
| Home People Lab Write-Up 1 | Lab Write-Up 2 | Lab Write-Up 3 Lab Write-Up 4 | Lab Write-Up 5 | Lab Write-Up 6 Course Logistics For Instructors Photos Wiki Editing Help | |||||||||||||||||||||||||||||||||||||||||||||||||||||
|
OUR TEAM
LAB 3A WRITE-UPDescriptive StatisticsAll Groups
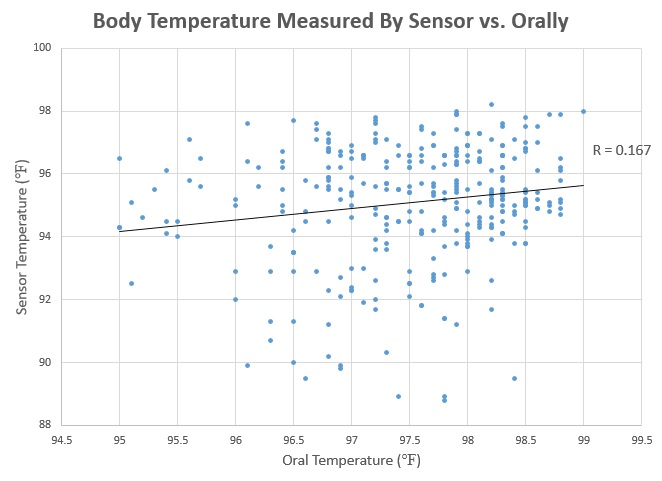
ResultsCalculating the Pearson's R value for the test yielded R=0.167. An ideal test would yield an R value of 1.000, as this would mean that each sensor temperature value equaled the oral temperature value taken at the same time.
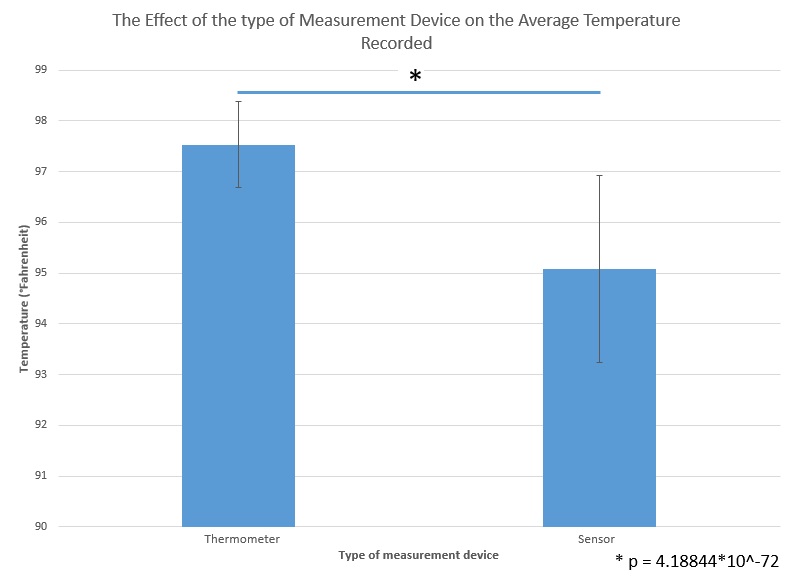
AnalysisAccording to the T-test, there was a significant difference between the oral and sensor temperatures. The p value of 4.18844*10^-72 means that the two groups yielded a correlation with a very small chance that the data was incorrect. However, this small p value is bad because it means that the results were not close to equal, which they need to be in this experiment for accurate results. This means that the results were accurate and the data that was collected has a high probability of recurring if the tests were performed again. Even though the results were proven to be true, they show that the sensor was not a good way to test temperature when comparing oral temperature. As shown with the Pearson's R (R=0.167) the oral and sensor temperatures were not close to a one to one ratio. This proves that the temperatures from each device varied greatly.
Summary/DiscussionThere were multiple design flaws in the sensor; as a result, there was a significant difference between the oral thermometer and the sensor (p-value <.05, meaning there is little room for error). The difference could be due to the design flaw that makes the sensor very temperamental when it comes to where the sensor is positioned. If it is not exactly placed under the arm, the sensor will read off a very low body temperature. This could occur because the sensor is on the outside of the body allowing some of the sensor to be exposed to the rooms temperature rather than the oral thermometer which is enclosed in the subjects mouth, or simply because there is more blood flow to certain areas of the body rather than others so more heat is detected in those areas. Proof that the sensor is sensitive to where it is placed on the body was discover in the outdoor trials. The temperature given by the sensor would go up or down a few degrees depending on the way the subject was sitting. Another design flaw is that the device takes some time to warm up and read a more accurate body temperature. The first few readings in the data could have thrown the results off because the device was still warming up, much like a thermometer takes a few moments to rise to the peaking temperature. The Pearson's Coefficient (r) was equal to .167, meaning that the data follows no particular trend but has a slight positive relationship. All in all, RAIIN is not a truly reliable product due to the potential external interference. LAB 3B WRITE-UPTarget Population and NeedThe health of babies and children is one of the most important concerns in America. With the Baby Depu-T, accurate temperature monitoring is made simple and safe for children of all ages. The device is especially useful for fever-prone newborns due to the nature of the device, a patch under the users arm to get the most accurate reading possible as well keeping it out of reach of the infant. With the wireless watch sensing the patch's activity, a new mother will know instantly if the newborn's body temperature is abnormal. Sales of the Baby Depu-T are expected to be successful as new mothers are often willing to buy whatever necessary to ensure the health of their babies.
Device Design
The Baby Depu-T is a 2x2 inch square, made of a flexible material with 9 individual sensors (each 0.5 inch by 0.5 inch). The device is attached by adhesive strips under the arm of the baby, on the side of the chest. The adhesive strips need to be changed once daily; after bathing is recommended. Each sensor takes body temperature readings and averages them together, and then sends the data via a wireless connection to a watch on the mother's wrist. The mother can then read the data directly on the watch or plug the watch's SD card into a computer to see patterns in the baby's temperature. The computer software is included with the device.
Descriptive StatisticsBabies
Inferential StatisticsBabies
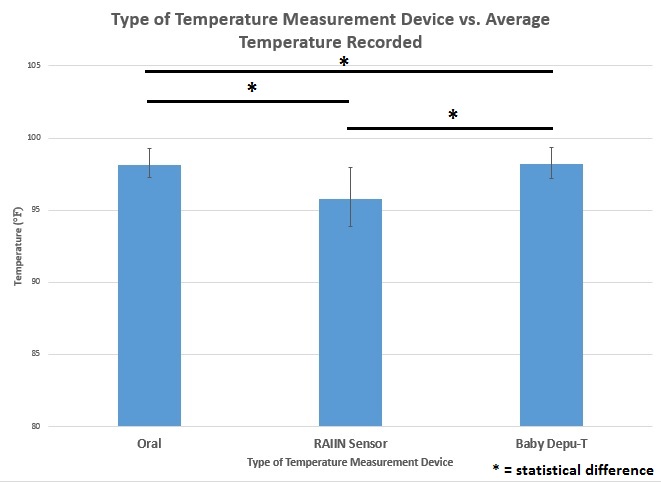
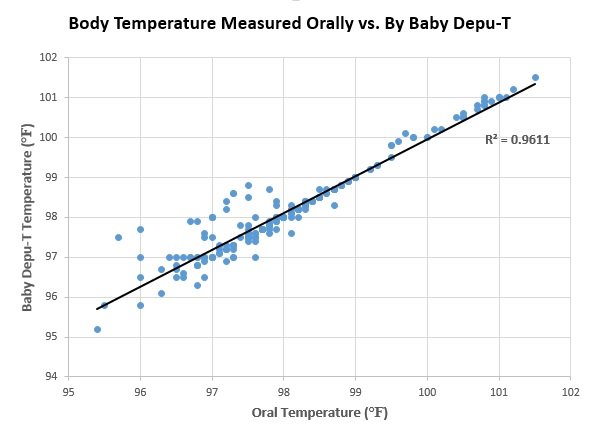
The Baby Depu-T was tested against a normal oral thermometer and the leading competitor (the RAIIN senor). The corrected P value revealed a significant statistical difference between the Baby Depu-T and competitor. When testing the temperature of the baby, the results had a significant correlation with the oral thermometer. The Baby Depu-T had a Pearson's R value of 0.9611 while the RAIIN senor had a Pearson's R value of 0.6164. Although the RAIIN sensor showed an improvement in accuracy when testing the baby, the Baby Depu-T showed a much greater correlation (extremely close to a one to one ratio).
Graph
| |||||||||||||||||||||||||||||||||||||||||||||||||||||


