BME100 f2013:W900 Group8 L3
| Home People Lab Write-Up 1 | Lab Write-Up 2 | Lab Write-Up 3 Lab Write-Up 4 | Lab Write-Up 5 | Lab Write-Up 6 Course Logistics For Instructors Photos Wiki Editing Help | |||||||
|
OUR TEAM
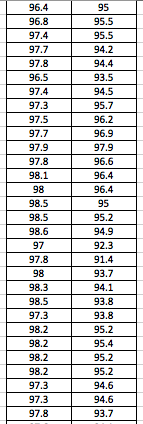
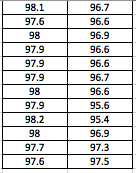
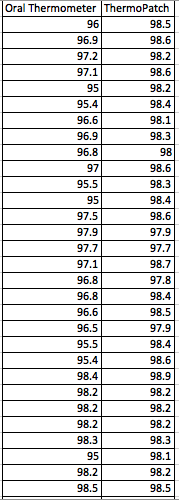
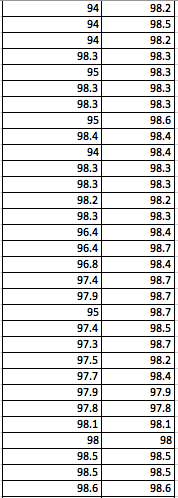
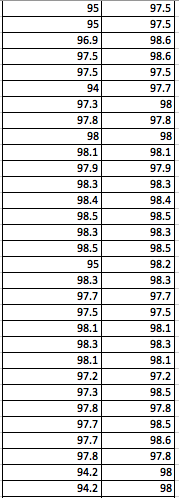
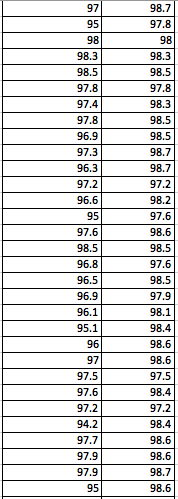
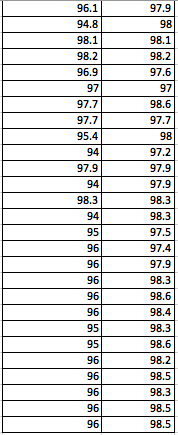
LAB 3A WRITE-UPDescriptive StatisticsBy comparing in the data in the data charts above, it is clear to see a significant difference between the sensor, and traditional oral readings. The data shows that the traditional oral readings have much better accuracy, and have a lower standard deviation. In comparison, the sensor gave data that was more sporadic, giving it a higher standard deviation. The data for the sensor also contained points which were so low, it would be impossible to be considered "accurate" unless the subject was dead. From this, it is clear to see that the sensor was not accurate, or reliable at all throughout this experiment.
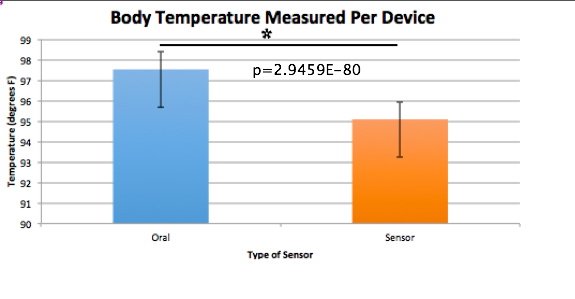
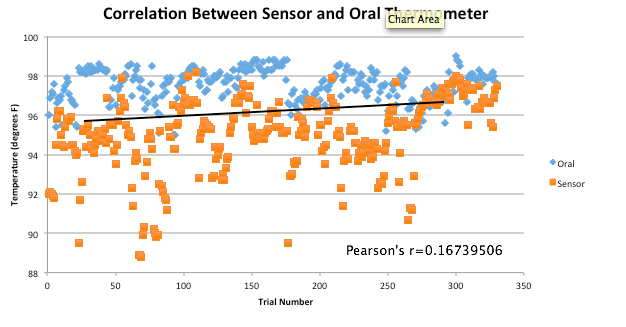
ResultsThe following graph gives a better perspective of the data collected and the range of temperatures recorded from each device.
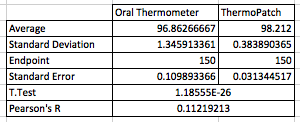
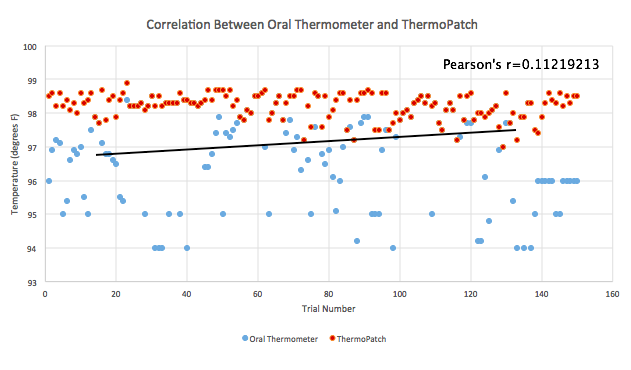
AnalysisThe T-Test value for this set of information is 2.9459E-80. Since this value is less that 0.05, there is a statistical difference between the two values. This statistical difference shows the significant invalidity of the sensor. Its average of 95 degrees shows that there are a number of outliers held in the data. These outliers skew the data drastically, proving the sensors unreliability. However, the oral readings prove to show more validity, due to its lower standard deviation and more accurate readings. Through the data, it is shown that the oral readings never drop below 97 degrees, where as the sensor readings drop as low as 92 degrees. A reading of 92 degrees Fahrenheit would only prove to be accurate if a subject was suffering hypothermia. Since none of the subjects in the experiment suffered through this, it is safe to assume this data is invalid. The Pearson's R value for this set of data is 0.16739506, which shows the correlation between the sensor and the oral thermometer. This number describes the poor correlation between the sensor and the oral thermometer.
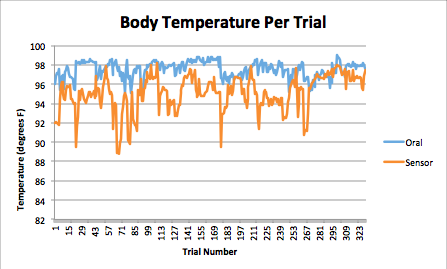
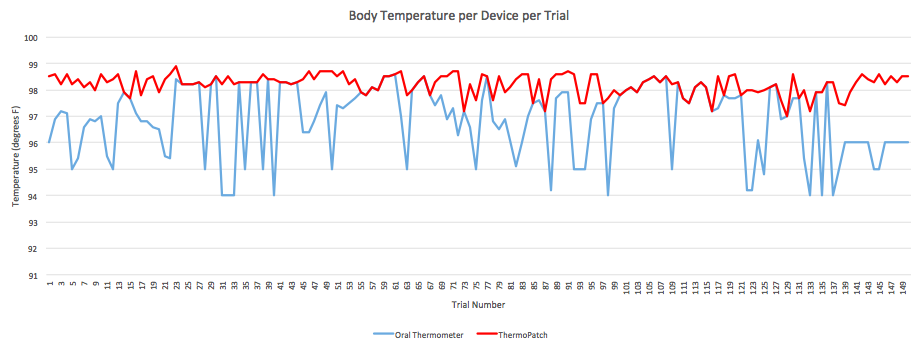
Summary/DiscussionAs one can see above, the Body Temperature per Trial graph shows that the temperature sensor displayed temperatures that were consistently lower than the standard oral thermometer. Only rarely did it approach the same temperature as the oral thermometer. When considering the results of the T-test, one can see a marked statistical difference in measured temperature between the sensor and the control, a standard oral thermometer. The implications of these results along with the flaws of, and ways to improve the device are described in more detail below. To begin with, the device was difficult to turn on. It required one to use their thumbnail or some other flat object. This could be to prevent the subject from inadvertently shutting the device down, but there are already other, easier to access, methods to prevent shutdown in many other electronics. Next, the device would not communicate over Bluetooth with the subject's iPhone(tm), this could be due to user error, or a defect in the subject's iPhone(tm), but other subjects were having the same issues. When one could get the product to operate correctly, it took a significant amount of time for the unit to calibrate, much longer than a simple, under the tongue, thermometer would take. Further, one must rely on the adhesives that come with the device to attach the device to the subject's arm. The adhesive wasn't very comfortable to wear, it was irritating to the skin, especially after left on for an extended period of time. With such a bulky device, it may be more comfortable to have an arm band built into the device. Finally, the device takes an extremely long time to reach some semblance of accurate readings. When it has reached its maximum accuracy it is still off by 2 to 4 degrees Fahrenheit when compared with a reliable mouth thermometer. For everyday situations, this error may be acceptable, but in life threatening situations where fevers are involved, this error can be deadly. Even when it has reached its best measuring capabilities, its mechanical unreliability comes out, and it shuts down spontaneously. The best paths to take to improve this device is to decrease the size of the device, small enough to fit under a patch that could be twice the size of a nicotine patch. Make the edges more round to improve the comfort of the wearer. Make the power on indicator light more visible, especially to the subject who may be wearing it. Perhaps, increase the surface area of the metal contacts to decrease warm-up time of the device for quicker accurate measurement. If one cannot decrease the size of the device for any reason, it may be best to include a Velcro(tm) arm band to make the device more comfortable to wear, and to keep the device more secure. LAB 3B WRITE-UPTarget PopulationNinja Med's Thermopatch was targeted towards the elderly and athletes. These separate groups were targeted because the Thermopatch allows the elderly to have more freedom allowing them to care for themselves, and athletes are able to keep track of their body temperature during training and games. Ninja Med's Thermopatch provides great convenience for both of these target populations.
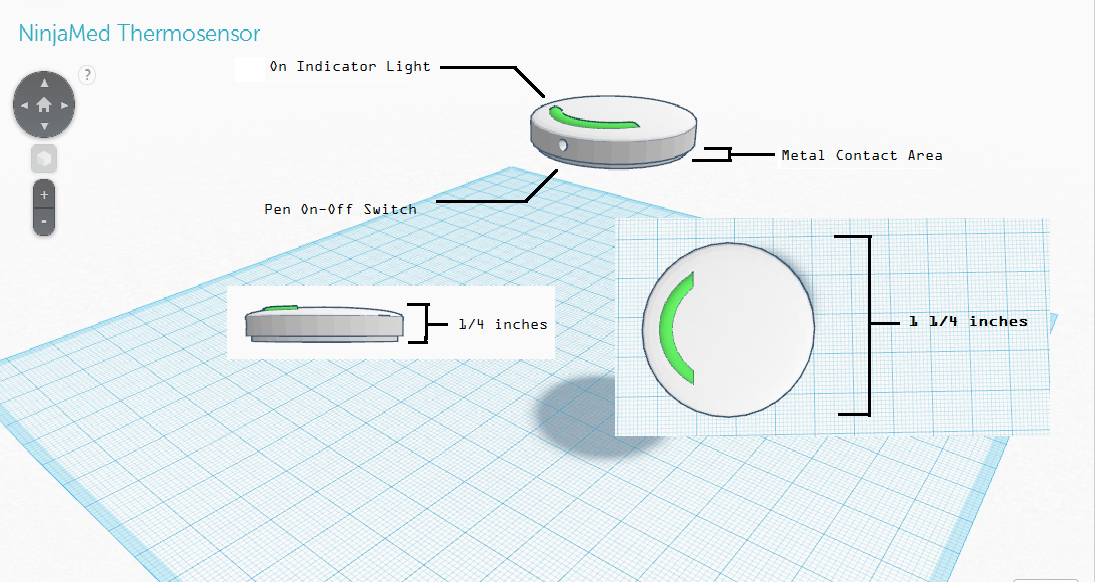
Device DesignBelow is a diagram of the Thermopatch. The Thermopatch is 0.25 inches thick to provide comfort for users, ensuring users hardly notice it while on. The device comes loaded with a pen on-off switch, this ensures the device stays on throughout the day. Due to this, the device should only power down by users intentions. With a green arc shaped LED light, users can easily determine if the device is turned on, or off. The device also includes adhesive patches similar to band aid's or nicotine patches. These patches are used to keep the device to the user's skin, ensuring the device records accurate body temperature. Inferential Statistics
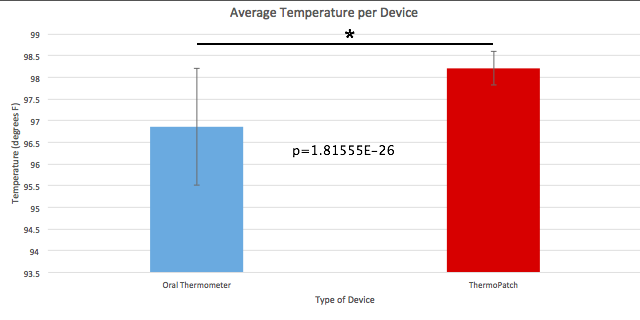
GraphThe graph below displays the data and shows the reliability of the ThermoPatch compared to the reliability of the oral thermometer. The graph portrays that there is more reliability from the ThermoPatch than the oral thermometer.
| |||||||


