BME100 f2013:W900 Group6 L3
| Home People Lab Write-Up 1 | Lab Write-Up 2 | Lab Write-Up 3 Lab Write-Up 4 | Lab Write-Up 5 | Lab Write-Up 6 Course Logistics For Instructors Photos Wiki Editing Help | ||||||||||||||||||||||||||||||||||||||||||||||||||||||||||||||||||||||||||||||||
|
OUR TEAM
LAB 3A WRITE-UPDescriptive Statistics
Results
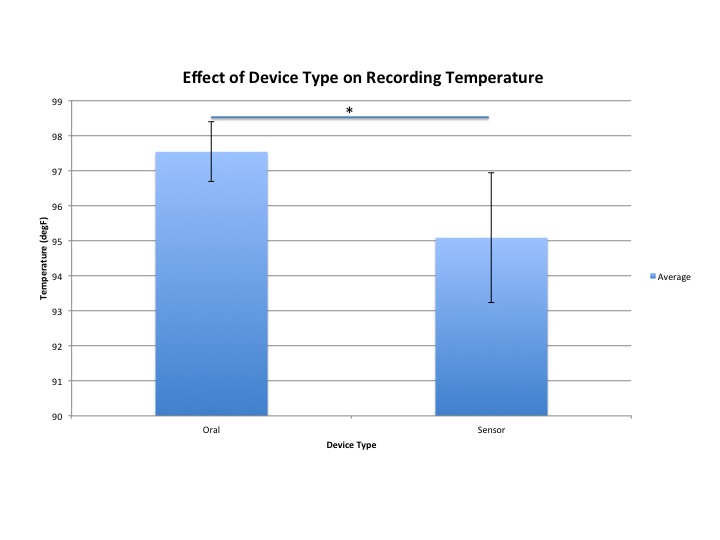
AnalysisPearson's r-value: 0.167395055 T-Test: 4.18844E-72 < 0.05, so there is a statistical difference between groups
Summary/DiscussionThe wireless thermometer used for Raiing's Vitals Monitor iPhone app has several design flaws. The rectangular shape of the thermometer is uncomfortable when pressed up against a user's underarm. In addition, the wrap provided in the kit for the sensor is not a strong adhesive, so it does not stick to the patient for a prolonged period of time--making additional tape a necessity. Another flaw to the device is that if there are multiple devices in the same vicinity, then there is no way to determine which specific device belongs to which individual because the Bluetooth picks up the same device name for all wireless thermometers. Finally, the most important aspect of the device is to record the patient's body temperature, and our data clearly indicated that the temperature reading of the Vitals Monitor iPhone app is inaccurate. There is a significant difference in the reading of the wireless thermomter when compared to an oral thermometer. During our lab group's testing period, the wireless thermometer generally gave a reading that was at least two degrees below the temperature of the oral thermometer. Another issue for the device directly involved the Vitals Monitor app. When recording data, the graph would not update automatically, the user would have to slide back-and-forth between 6-hour time periods in order to update the current graph. After reviewing our data we found that the p-value being less that .05 meaning that our results where statistically significant. In the descriptive data we see that the mean of the oral thermometer was 97.53242424 while the mean of the sensor was 95.08181818 which is a 2.4506060606 degree difference. The standard deviation of the oral thermometer was 0.844800044 while the sensor thermometer was 1.849185238 which is a 1.004385194 difference. Looking at the graph it is evident that the error bar is high in the sensor thermometer. Visually it is noticeable that the temp taken inside the body (the oral thermometer) produced higher readings than that of the external sensor thermometer. This brings up to discussion, knowing that internal temperature is the most accurate form of reading a person’s temperature. On average external temperatures are expected to show lower readings. In example: An internal temperature usually runs within the ranges of 98.6 degrees ferinheight, while external temperatures run in the ranges of 97.7 degrees ferinheight. Was it appropriate to compare/contrast the internal temperature readings to that of an external temperature readings? Had we used an external thermometer to compare and contrast the readings of the “raiing sensory” would this cause the error bars to decrease? To accurately compare and contrast temperature readings, it is important to use devises that are more comparable. In this case, we would change the internal temperature reading devise (oral thermometer) and replace it with an external temperature reading devise (i.e. an external temporal reading devise). In order to make this medical device more efficient, the device should be a re-shaped into an electrode shape (similar to a patch). This would allow the device to be placed on the subject in a much more comfortable and reliable manner. For our testing purposes, most subjects were young adults and fully grown, but if this current device was to be used on a baby or toddler, the device would be far too bulky to be effective and give an accurate reading. If patches became the new design for the sensor, then they would need to be disposable, making the product cost a bit more, but this new shape would also resolve the issue of the device not sticking to the subject for a prolonged duration. If the medical device were to maintain its current shape, then there should be a velcro arm wrap that has a pocket in order to insert the device and ensure that it remains close to the user's armpit. Besides shape, another proposal for this medical device is to have each wireless thermometer have its own unique device name, so that when using Bluetooth, each owner will specifically know which device belongs to them. The device and the Vitals Monitor app continuously lost connection, so in order to increase efficiency, the Bluetooth on the wireless thermometer would need to give off a stronger signal so that the connection is maintained.
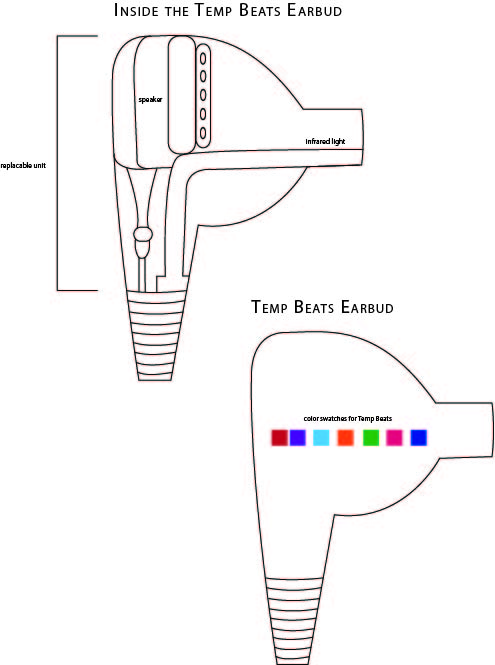
LAB 3B WRITE-UPTarget Population and NeedThe target population we chose for this project is marathon runners. Marathon runners put their bodies through extreme training that can result in drastic changes in body temperature. It is possible for a runner's internal body temperature to reach as high as 105 degrees, which greatly increases the chance of dehydration. In contrast, some marathons take place in much cooler environments, where participants in the marathon run the risk of hypothermia due to an internal temperature that is lower than the average body temperature. To combat this, we have designed a thermometer (TempBeats) designed specifically to measure the body temperature of marathon runners during their races.
Device Design
Inferential Statistics
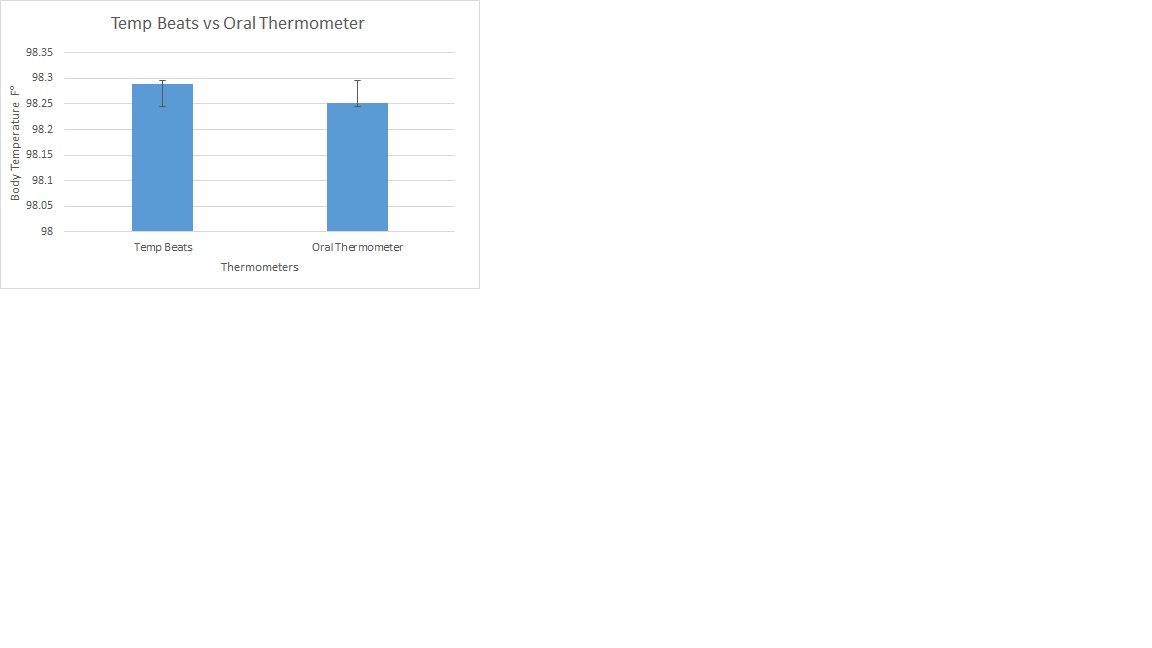
Pearson's r-value: 0.272928775 T-Test: 0.916790792 > 0.05, so there is no statistical difference between the two groups
Graph
| ||||||||||||||||||||||||||||||||||||||||||||||||||||||||||||||||||||||||||||||||


