BME100 f2013:W900 Group3 L3
| Home People Lab Write-Up 1 | Lab Write-Up 2 | Lab Write-Up 3 Lab Write-Up 4 | Lab Write-Up 5 | Lab Write-Up 6 Course Logistics For Instructors Photos Wiki Editing Help | ||||||
|
OUR TEAM
LAB 3A WRITE-UPDescriptive StatisticsInside Reading #1:
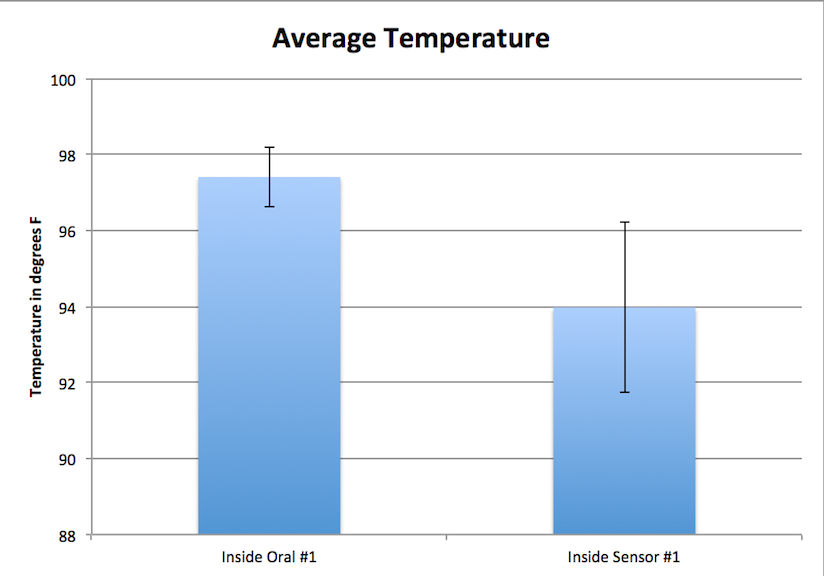
Average Temperature: 97.408 degrees F Standard Deviation: 0.792832759 Sensor (RAIING Device) Average Temperature: 93.976 degrees F Standard Deviation:2.250575902
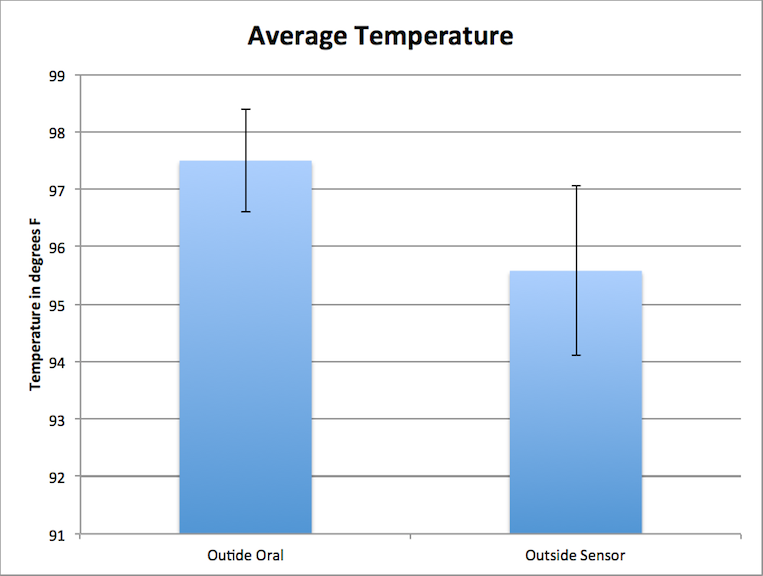
Average Temperature: 97.49666667 degrees F Standard Deviation:0.897227262 Sensor (RAIING Device) Average Temperature: 95.57944444 degrees F Standard Deviation: 1.479494751
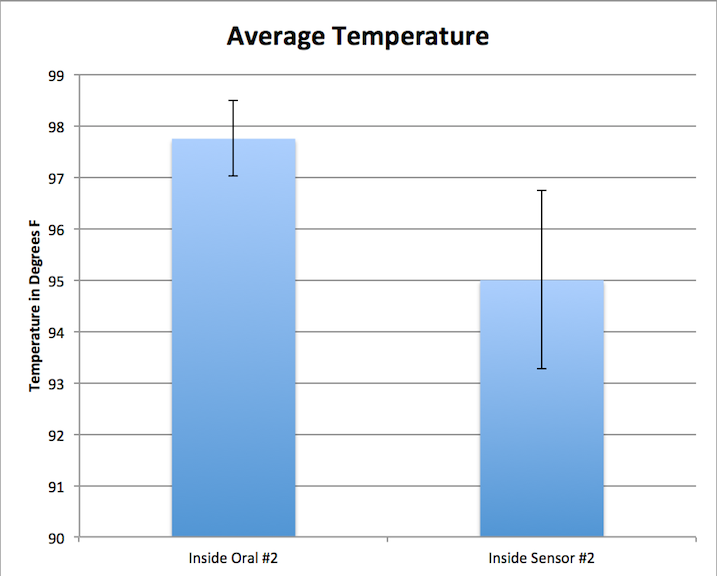
Average Temperature: 97.742666667 degrees F Standard Deviation:0.730452162 Sensor (RAIING Device) Average Temperature: 94.993333333 degrees F Standard Deviation: 1.730125236
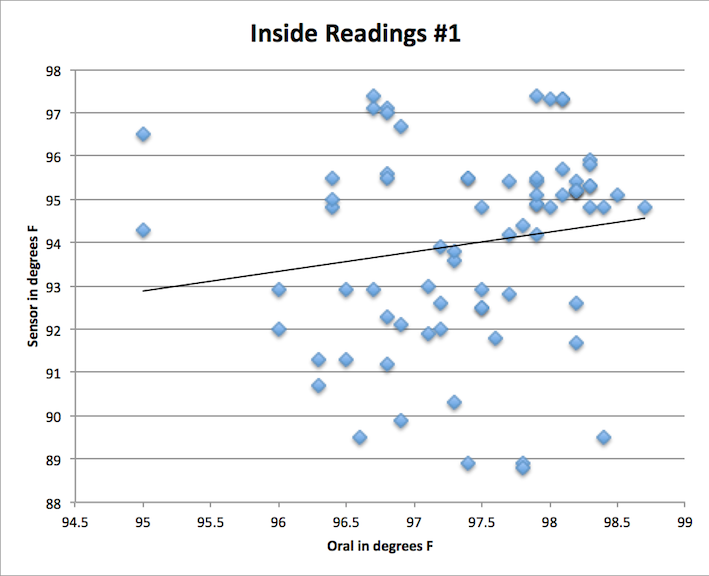
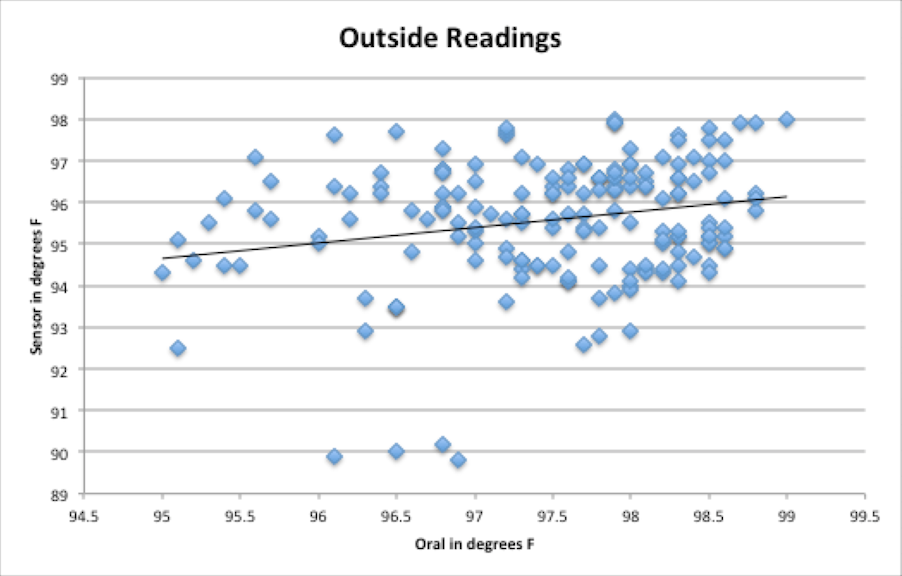
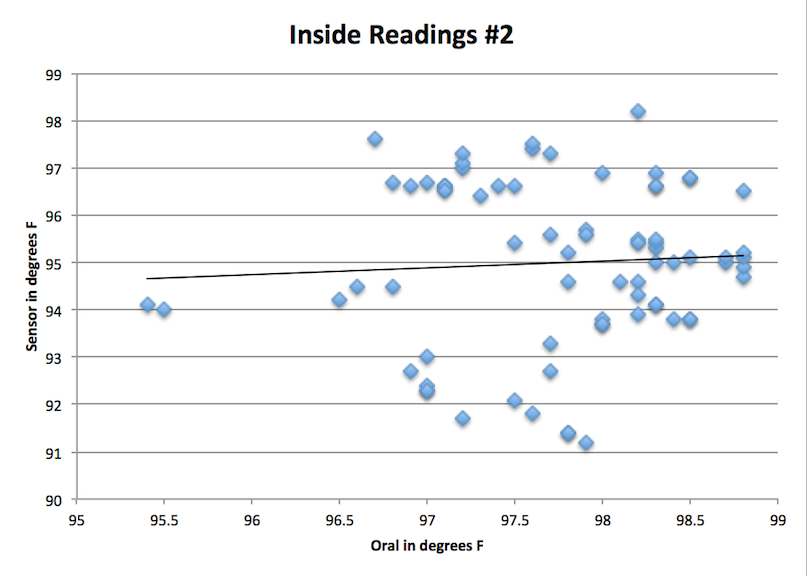
ResultsT-Test: 8.22401E-25 Corrected P Value: 0.000667 Pearson's r: 0.160060051 (shown by black linear trend line) T-test: 2.87443E-39 Corrected P Value: 0.000278 Pearson's r: 0.225273129 (shown by black linear trend line) T-Test: 2.11196E-25 Corrected P Value: 0.000667 Pearson's r: 0.060429623 (shown by black linear trend line)
AnalysisBy analyzing our statistics, it is easy to see the flaws in the RAIIN temperature detecting device versus a standard oral thermometer. There were many issues involving the connection of the device to the iPhone app itself, thus making it difficult to get a reading at all. The resulting values from each of the three t-tests were all less that the corrected p-values. This means there is a statistical difference. However, this is not the result wanted; the difference shows that the RAIIN device is flawed in comparison to a proven and functioning device--the oral thermometer. Also, the resulting Pearson's r value was extremely low, which shows a small positive correlation between the oral thermometer readings and the RAIIN sensor. To demonstrate that the sensor works as effectively as the oral thermometer, a Person's r value of 1 is desired. In addition, the standard deviation for the RAIIN device ranged between 1.48 degrees and 2.25 degrees establishing that the device did not provide consistent readings, even when only compared to itself because the desired standard deviation of the experiment would be 0--therefore proving the inefficiency of the RAIIN device compared to the oral thermometer.
Summary/DiscussionIt can be concluded that the RAIIN sensor failed to provide accurate body temperature readings when compared to the oral thermometer readings. The readings were consistently lower and more varied than the oral thermometer readings and should be considered invalid. The constant fluctuations, and inaccuracy caused from the device can lead it to be considered not accurate. The lower reading implies that the sensor was not sensitive enough, or the location of the device did not provide sufficiently accurate internal body temperatures. The location of the sensor, just below the armpit, undoubtedly varied slightly between individuals who participated in the study. The investigation should probably have been altered to take a reading using an established device and the RAIIN system from the same location on the body. If there was a correct, proven place that the device would work consistently and accurately, the RAIIN device could have great potential. This would isolate the device as the source of the problem. Some variance was noticed when the arm was elevated from when the arm was allowed to relax against the body. Not having a standard protocol for reading this sensor was undoubtedly an issue with the experimental design itself. The device also had connectivity issues and had to be isolated from similar devices in order to sync properly, which could be problematic if the device was intended to become ubiquitous. A different method of syncing devices would be preferred in the setting that the RAIIN system was tested in. In addition, when the participant lowered the measured arm, there seemed to be a consistent lack of connectivity and the device had to be activated repeatedly. This could diminish usefulness in many basic applications of the product. Having to press the button and raise your arm in the air for every reading might not always be practical, particularly in healthcare scenarios. This also seems to defeat the underlying convenience appeal that distinguishes this product from more traditional methods of obtaining an internal body temperature. The most efficient areas to take internal body temperature is the ear lobe, under the tongue, and the rectum, but these places prove to be ineffective during a long period of time. For example, one may need to record body temperature at short intervals while exercising. This leaves the under the arm sensor to be the next effective option for taking internal body temperature, but according to the results the temperatures of the readings were inconsistent with the comparison of the oral thermometer. Another possible area for taking internal body temperature would possibly be the diaphragm because it is stationary mostly unlike the arm. This area also proves useful for taking heart rate data, which could also need to be kept track of when recording body temperature.This modification would fix the complication of the raising of the arm every time data is recorded. Also it is likely that the sensor could have potentially took in account skin temperature that unfortunately does not correlate with body temperature because in order to take body temperature the device would have to take in account the pulse artery temperature of the individual, which again would correlate with your heart rate if graphed theoretically--giving the pule artery temperature, your body temperature.
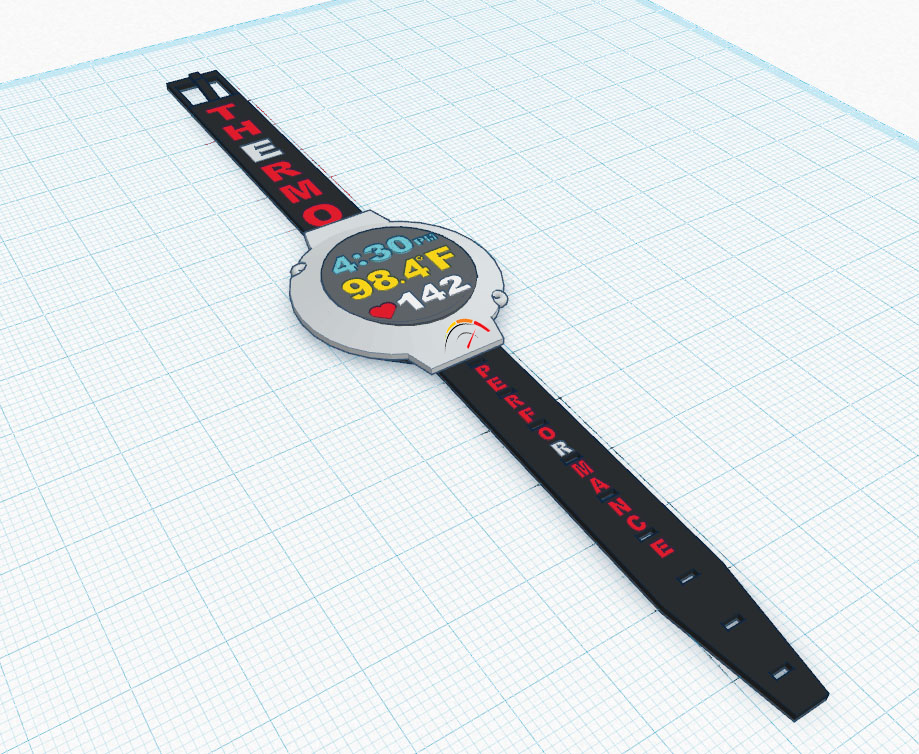
LAB 3B WRITE-UPTarget Population and NeedThermo Performance - Start optimizing your workouts!!!!
Device Design
Inferential Statistics
Graph
| ||||||

