BME100 f2013:W900 Group3 L2
| Home People Lab Write-Up 1 | Lab Write-Up 2 | Lab Write-Up 3 Lab Write-Up 4 | Lab Write-Up 5 | Lab Write-Up 6 Course Logistics For Instructors Photos Wiki Editing Help | |||||||
|
OUR TEAM
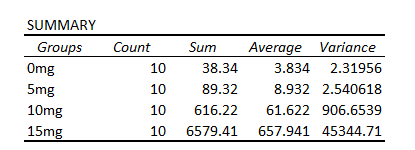
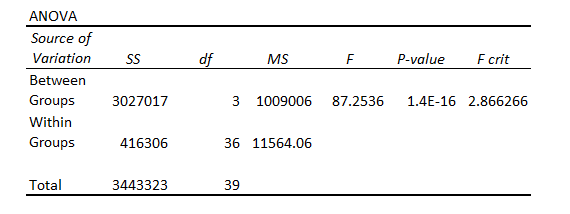
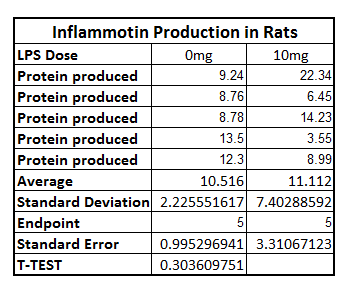
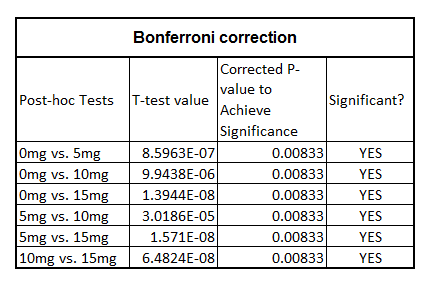
LAB 2 WRITE-UPDescriptive StatisticsExperiment 1: LPS Dosages in Humans The table above left shows the statistics of how certain dosages of lipopolysaccharide affect the production of inflammation. In the table above right, we used the ANOVA test to analyze our data from more than 2 groups and to establish a p value. We need this to later determine if the data is significant and if the dosage amount has an effect. Experiment 2: LPS Dosages in Rats The table above contains the T-Test run to compare the results of two different dosages of LPS.
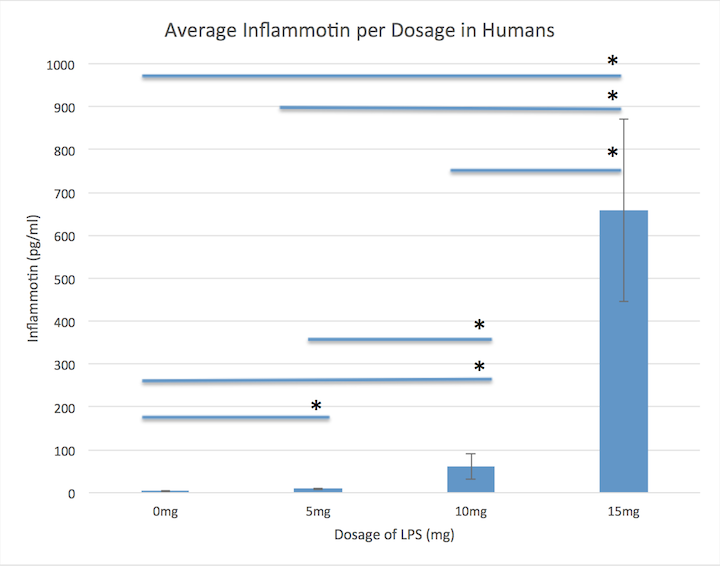
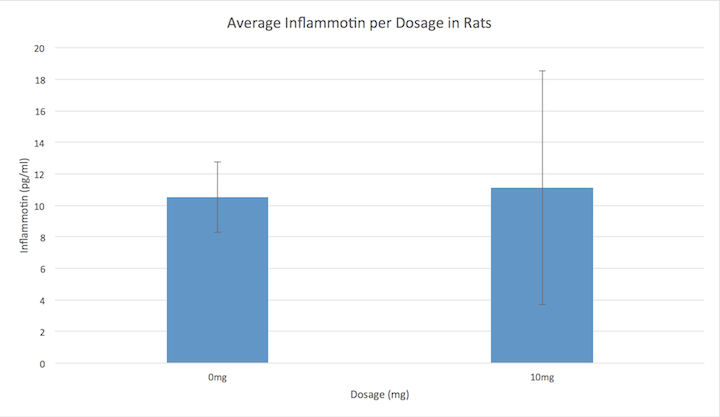
ResultsAbove is the graph of the average Inflammotin produced per human subject for each dosage. The graph also includes error bars, which show how the data varied. The error bars are increasing and offset so we can infer that the data is significant. The graph for the average Inflammotin produced in rats as a result of LPS dosage shows that the dosage has no effect on the production. Also, the error bars show that the Inflammotin production varied greatly within each dose therefore the data shows no significance.
AnalysisExperiment 1 Experiment 2 In the graph named "Inflammotin Production in Rats," the T test produces a result over the .05 threshold allotted for our p-value, indicating that the test could not support a significant difference in the two groups.
Summary/Discussion
| |||||||

