BME100 f2013:W900 Group18 L2
| Home People Lab Write-Up 1 | Lab Write-Up 2 | Lab Write-Up 3 Lab Write-Up 4 | Lab Write-Up 5 | Lab Write-Up 6 Course Logistics For Instructors Photos Wiki Editing Help | |||||||
|
OUR TEAM
LAB 2 WRITE-UPDescriptive StatisticsExperiment 1: Human Study 5mg: 10mg: 15mg:
Experiment 2: Rat Study 10mg: This section was worked on by Dylan, Daniel, and Nick.
Results
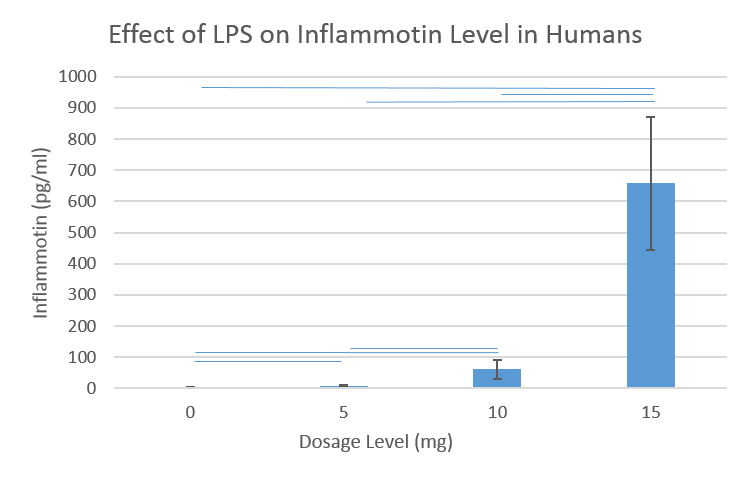
AnalysisIn the first experiment with humans, an ANOVA test was conducted resulting in a p-value of 1.40E-16. After Bonferonni correction, the new alpha level was set at 8.33E-3 (rather than .05). Since the p-value was less than 8.33E-3, we can conclude that there is a statistically significant difference between levels of dosage of LPS in humans. In the second experiment with rats, a T-test was conducted resulting in a p-value of .8674035. Since the p-value was greater than .05, we can conlude that there is no statistically significant difference between levels of LPS dosage in rats. Worked on by Daniel and Dylan
Summary/DiscussionIt was concluded that there is a statiscally significant difference in the Inflammotin levels in humans when the dosage of LPS is increased. In humans, the doses of LPS between 0mg and 10mg produced less variance of Inflammotin levels than when a dose of 15 mg was given to the subjects. However, when the experiment was repeated on rats, the increase in the dosage of LPS did not yield as large of a difference in Inflammotin levels. Providing the human subjects with 15mg of LPS caused them to produce over 100 times the amount of Inflammotin that occurred when giving them 0mg to 10mg. After testing the rats, the results yielded a p-value of .8674035, meaning the results were insignifcant because the p-value was greater than .05 (averages were too close together). Worked on by Kirstin Peters & Matt Hanson & Nick Vale
| |||||||


