BME100 f2013:W900 Group16 L2
| Home People Lab Write-Up 1 | Lab Write-Up 2 | Lab Write-Up 3 Lab Write-Up 4 | Lab Write-Up 5 | Lab Write-Up 6 Course Logistics For Instructors Photos Wiki Editing Help | ||||||
|
OUR TEAM
LAB 2 WRITE-UPDescriptive StatisticsUsing the raw data given we calculated averages of Inflammotin (pg/ml), standard deviation, endpoint, and standard error for each dose of LPS. Experiment 1:Human Study Experiment 2:Rat Study
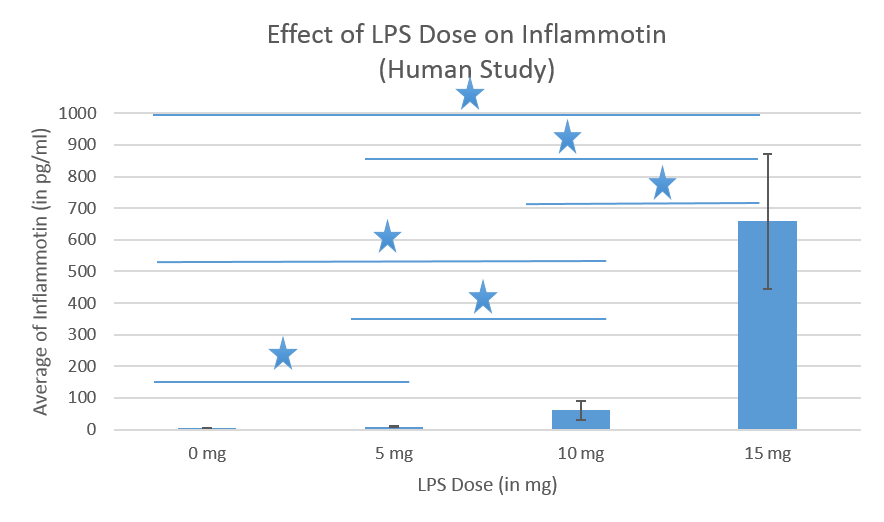
ResultsExperiment 1: Human Study This bar graph displays that as the dose of LPS increases, the average amount of Inflammotin found in the elderly increases. Each group has ten subjects. The error bars represent our standard deviation. The stars represent the statistical significance between each dosage amount.
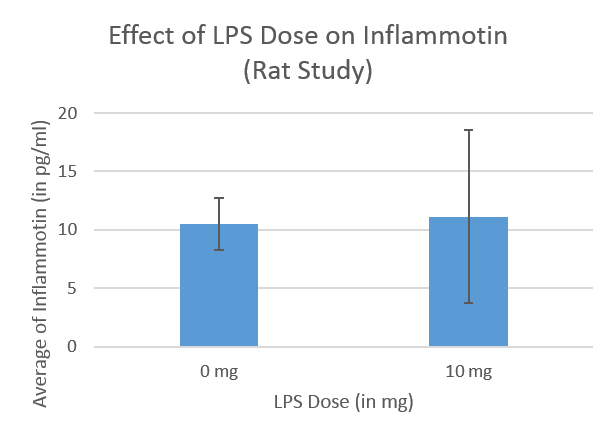
This bar graph displays that as the dose of LPS increases, the average amount of Inflammotin found in the rats. Each group has five subjects. The error bars represent our standard deviation.
AnalysisPost-hoc Tests t-test value Corrected p-value to achieve significance Significant? 0mg vs. 5mg 8.59631E-07 0.0083333 yes 0mg vs. 10mg 9.94377E-06 0.0083333 yes 0mg vs. 15mg 1.39436E-08 0.0083333 yes 5mg vs. 10mg 3.01859E-05 0.0083333 yes 5mg vs. 15mg 1.57101E-08 0.0083333 yes 10mg vs. 15mg 6.4824E-08 0.0083333 yes For our human study, we ran and ANOVA test because there were more than 2 groups that were being compared. Based on the results gathered from our ANOVA test, we found out that the p-value was 1.4E^(-16). Since this p-value is less than 0.05, it is statistically significant however we used the Bonferroni Correction to determine the confidence interval. Our Bonferroni Correction gave us a value of 0.0125 justifying that the p-value did fall within the 95% confidence interval.
To evaluate the significance of the rat study, our group used a t test because we only had two groups to compare. A statistically significant p value is a value less than 0.05. We ran our t test, comparing the dependent variant inflammotin based on the given LPS dosage of 0 mg and 10 mg. Our calculated p value of 0.86740397, which is greater than 0.05, indicates that the difference between LPS dosages given to rats does not have a statistically significant effect on the presence of inflammotin found in the rat.
Summary/DiscussionIn the experiment testing the effect of lipopolysaccharide dosage on the protein Inflammotin on humans, the p-value (0.0125) is statistically significant. Thus, there is a correlation between lipopolysaccharide dosage (mg) and the amount of inflammatory protein (pg/ml). The group that was given a 5mg lipopolysaccharide dosage saw an increase in the average amount of Inflammotin (8.932 pg/ml)in comparison to the Inflammotin average of the control group which received placebos (3.834 pg/ml). Based on the results, a 5mg dosage of Inflammotin is sufficient in inducing inflammatory proteins in the elderly humans. In the experiment testing the effect of lipopolysaccharide dosage on the protein Inflammotin on rats, the p-value (0.867) is not statistically significant. There is not sufficient evidence to support the claim that lipopolysaccharide dosage is correlated to the amount of inflammatory protein present in rats. A 10mg dosage of lipopolysaccharide slightly increased the average amount of Inflammotin from the control group that took placebos (10.516 pg/ml) 11.112 pg/ml. No conclusion can be drawn to show that doses of the lipopolysaccharide induce inflammatory proteins in rats.
| ||||||


