BME100 f2013:W900 Group15 L3
| Home People Lab Write-Up 1 | Lab Write-Up 2 | Lab Write-Up 3 Lab Write-Up 4 | Lab Write-Up 5 | Lab Write-Up 6 Course Logistics For Instructors Photos Wiki Editing Help | |||||||
|
OUR TEAM
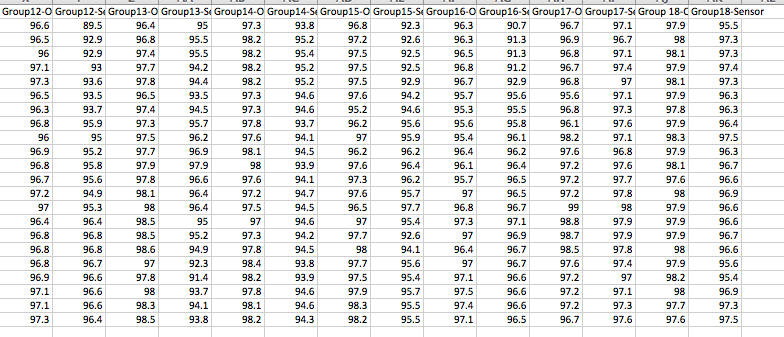
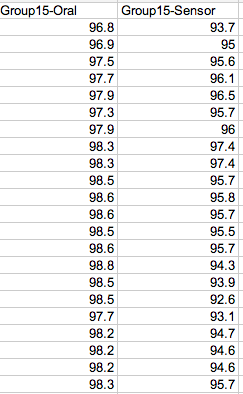
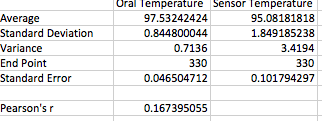
LAB 3A WRITE-UPDescriptive StatisticsIn order to determine accurate values for the data set, statistical values were taken from the set of values collected from the inside data set as well as outside. A total of 330 different trials were engaged in this data, allowing for 330 sets of data. For the temperature with the thermometer taken within the the inside data set, the average reading was 97.575 degrees For the data set taken with the sensor inside, the average reading was 94.485 degrees. This determines that there is definitely a difference within the data sets. Regarding the temperatures taken within the outside data set, the average reading with the temperature was 97.496 degrees. The temperature readings taken with sensor with the outside data, the average reading was 95.579 degrees This also signifies a large difference between both data sets. Taking the outside and inside data set into account, a t-test was done to show a value of 2.09E-72, which signifies a difference between the sensor and the thermometer. Taking Pearson's r correlation test into account, the value ended up with 0.167395055 proving that there is a significant difference between both the sensor and the thermometer.
Results
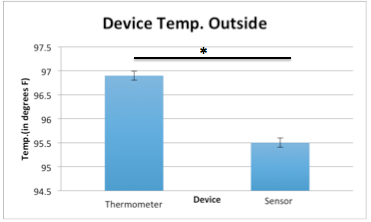
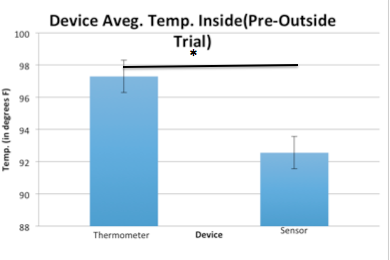
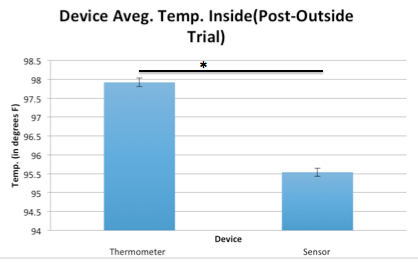
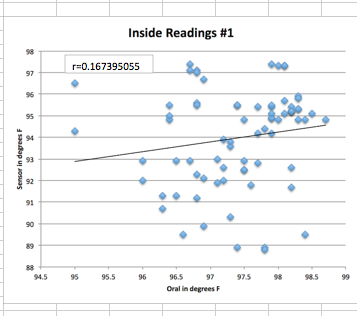
AnalysisPersonal Group Data: Because a p-value of 2.09E-72 was obtained and it is less than the given 0.05, it can be inferred that there is a statistical difference between both groups only when all the data is averaged together. When separated into three trials(inside pre-out, out, and inside post-out) It is found that there is no statistical difference between the devices, meaning they act very similarly. When a Pearson's r Test was conducted to calculate the correlation coefficient, It was concluded that the r value given is 0.167395055, which ultimately shows a weak, positive relationship between the values, verifying the results from the separated trials. Based upon the data received from the lab, it can be inferred that there is quite a difference between the readings of the thermometer and the sensor. The readings from the sensor were always lower than the ones received from the oral thermometer. While the oral temperatures given proved that the tester was healthy, the ones given by the oral readings showed a normally considered minimal temperature. For example, the initial reading that the tester's temperature was 93.7 is not possible.
Summary/Discussion
Given the inferential statistics, it can be concluded that there is a significant difference in the data according to the tests. The difference in the readings showed that the sensor acted like the tested and proven thermometer, but after the Pearson's Test it was shown that the device was not nearly as accurate or reliable as the proven thermometer. This is due do the variability of the sensor to correctly read the body temperature. Conclusion: We have concluded that the device we tested today is not not accurate, reliable, and the variability is high. The data has shown no correlation to that of the oral thermometer making it unusable and unreliable. Some flaws that we found while using the device were that it was way below the actual body temperature. The outside temperature and the temperature of the surroundings had a direct affect on the device's calculations. It also needed to be placed in an uncomfortable spot and when it was removed it would cause a bit of pain. The reading on the device itself vs the reading that was shown through the app were two completely different readings causing confusion as to which of the readings was correct. Honestly, the idea of a thermometer ran by an app is nice, however the practicality of it is not very high. The device needs to be remodeled and taken back to the drawing board, it has too many flaws to make it a viable product, even with some tweaking.
LAB 3B WRITE-UPTarget Population and NeedThe product, itrain, is an armband that targets athletes and other active people who need a way to measure temperature as well as heart rate during their everyday physical activities such as running, walking, playing sports, etc. When performing physical activity, it is very easy to trust a device that could quote possibly provide wrong information, making the athlete perform either too low or too high for their specific body capacity. Itrain, on the other hand, contains a wired sensor that is incorporated throughout the entirety of the band in order to process an accurate reading of the individual's temperature and heart rate. Because the sensors are specifically made to read temperature and heart rate accurately, the chances for error is significantly reduced. When compared to an oral thermometer's reading of an individual's temperature and heart rate, iTrain's readings are very similar, leading to the conclusion that it can be trusted by athletes to provide correct figures, allowing them to perform at their very best.
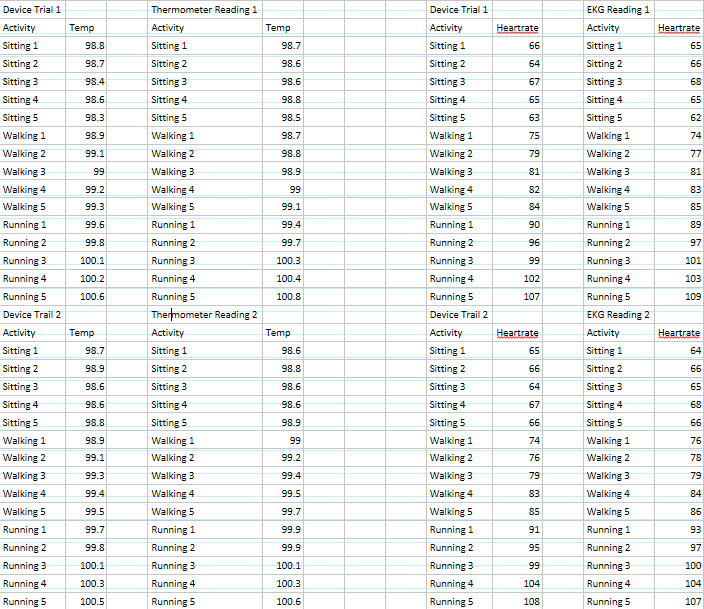
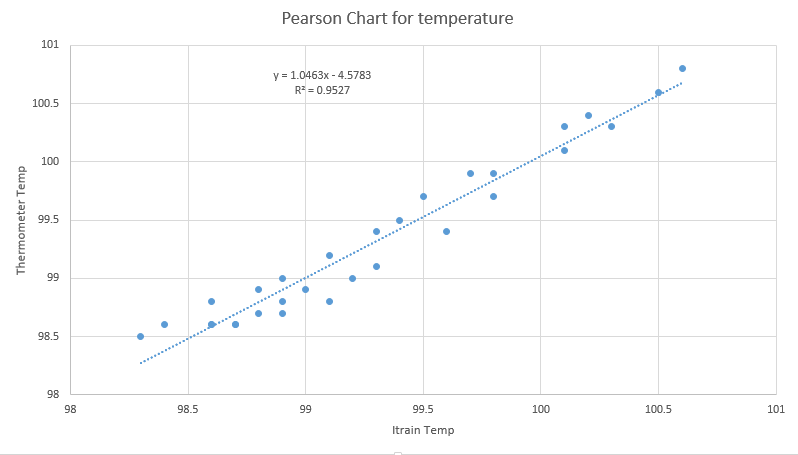
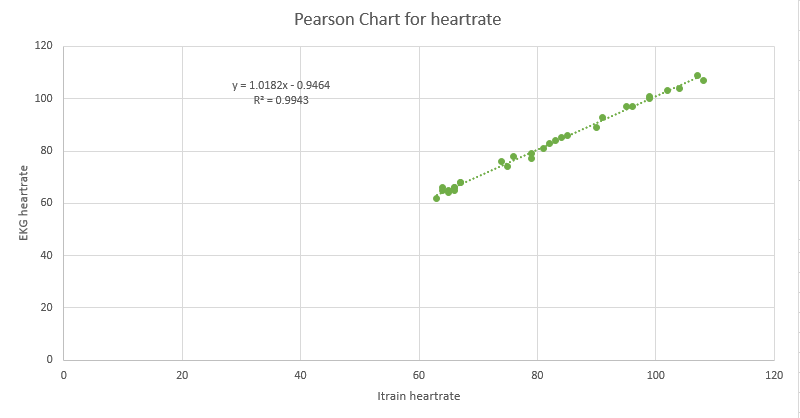
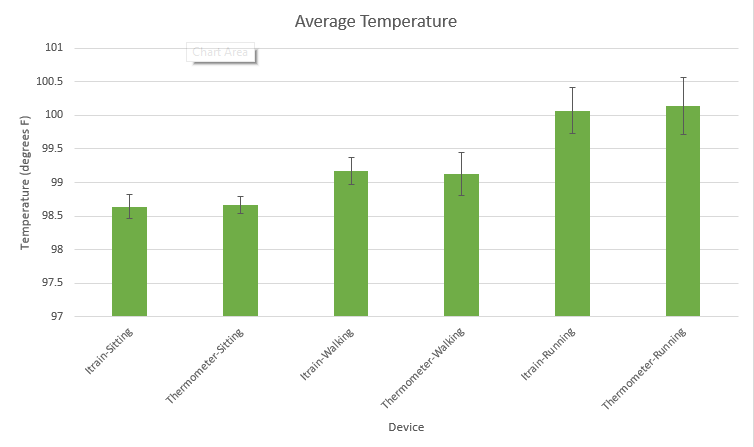
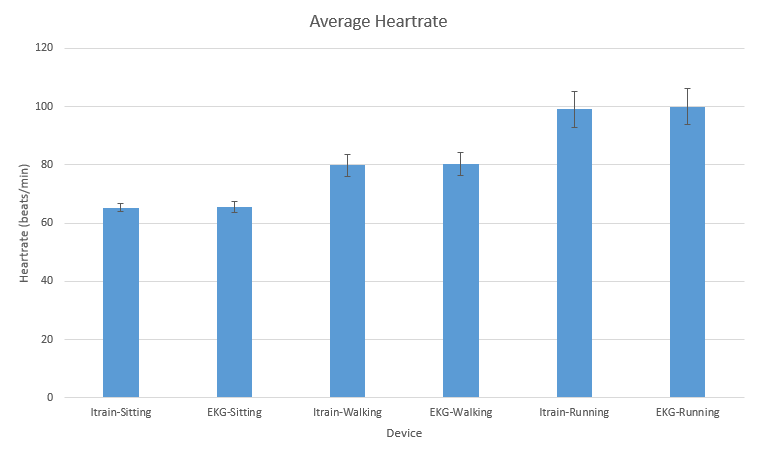
Device DesigniTrain is an armband that can be worn comfortably around an individual's arm, with a specific area for the placement of an iPhone/iPod/mp3 player to allow for the comfort of listening to music while performing physical activities. iTrain contains a wired sensor that is placed in areas around the armband, allowing for the most accurate reading of both temperature and heart rate. Because the sensor can obtain multiple readings, the chance for error is significantly reduced. The sensors, themselves, are waterproof to ensure proper readings regardless of the state of the individual. Whether they are running or swimming, iTrain will surely give the right reading. iTrain will be sold in multiple colors so as to match the colors of the newest iPhone in the market. Thus, individuals will be able to buy the special armband to compliment their phones or mp3 players. The market price for iTrain is $49.99; however, if an individual calls in at a certain time, the iTrain can be sold for a great deal of $39.99. Inferential StatisticsGiven the data from each of the tests, the t-test value between both the tests proved to be way below the p-value of 0.05, which indicates more than 95% confidence regarding our device. The statistical significance obtained proved that the data obtained was not due to merely coincidence. Both the oral thermometer and the iTrain armband are highly similar to each other. Graph
| |||||||


